
Тechnical analysis of currency pairs (Anton Hanzenko)
EUR USD (current price: 1.2370)
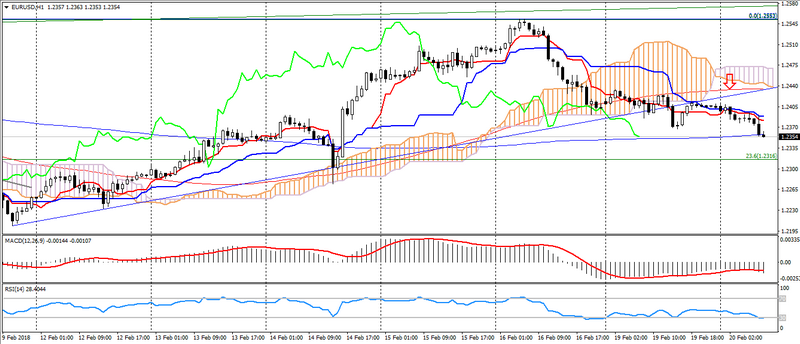
- Support levels: 1.2100 (September 2017 maximum), 1.1900, 1.1700.
- Resistance levels: 1.2600, 1.2750 (March 2013 minimum), 1.2270 (November 2014 minimum).
- Computer analysis: MACD (12,26,9) (signal- downward movement): the indicator is below 0, the signal line is in the body of the histogram. RSI (14) is in the oversold zone. IchimokuKinkoHyo (9,26,52) (signal – downward movement): the Tenkan-sen line is below the Kijun-sen line, the price is below the cloud.
- The main recommendation: sale entry is started from 1.2420, 1.2450, 1.2480.
- Alternative recommendation: buy entry is started from 1.2340, 1.2300, 1.2280.
The pair came out of the weekly uptrend on the correction of the American and the preservation of the downward signal of the Forex MACD indicator on D1.
GBP USD (current price: 1.3940)
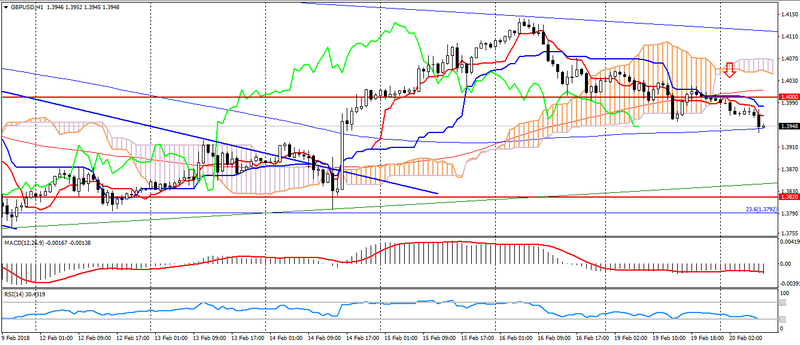
- Support levels: 1.4000 (April 2016 minimum), 1.3820, 1.3650 (September 2017 maximum).
- Resistance levels: 1.4350, 1.4500, 1.4750 (May May 2016 maximum).
- Computer analysis: MACD (12,26,9) (signal – downward movement): the indicator is below 0, the signal line is in the body of the histogram. RSI (14) is in the oversold zone. IchimokuKinkoHyo (9,26,52) (signal – downward movement): the Tenkan-sen line is below the Kijun-sen line, the price is below the cloud.
- The main recommendation: sale entry is started from 1.3970, 1.4000, 1.4050.
- Alternative recommendation: buy entry is started from 1.3920, 1.3900, 1.3870.
The British pound is also declining on the growth of the American, confirming the safety of the downward trend.
USD CHF (current price: 0.9320)
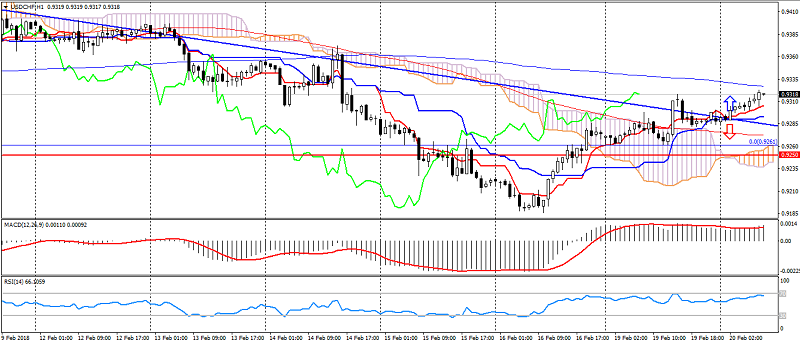
- Support levels: 0.9250 (August 2015 minimum), 0.9150, 0.9050 (May 2015 minimum).
- Resistance levels:, 0.9550, 0.9800, 1.0030 (November 2017 naximum).
- Computer analysis: MACD (12,26,9) (signal – upward movement): the indicator is above 0, the signal line is in the body of the histogram. RSI (14) is in the overbought zone. IchimokuKinkoHyo (9,26,52) (signal – upward movement): the Tenkan-sen line is above the Kijun-sen line, the price is higher than the cloud.
- The main recommendation: sale entry is started from 0.9340, 0.9360, 0.9390.
- Alternative recommendation: buy entry is started from 0.9300, 0.9280, 0.9260.
The Swiss franc also continues to weaken at the correction of the US dollar. As a result, the pair emerged from a downtrend.
USD JPY (current price: 107.00)
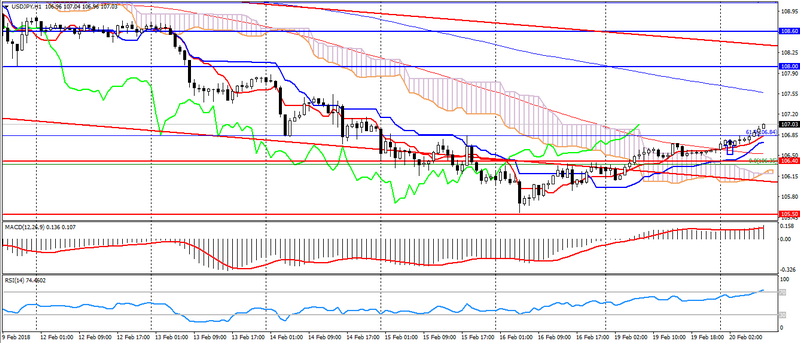
- Support levels: 106.40, 105.50, 104.50.
- Levels of resistance: 108.00, 108.60, 110.00.
- Computer analysis: MACD (12, 26, 9) (signal – upward movement): the indicator is above 0, the signal line is in the body of the histogram. RSI (14) is in the overbought zone. IchimokuKinkoHyo (9,26,52) (signal – upward movement, flat): the Tenkan-sen line is above the Kijun-sen line, the price is below the cloud.
- The main recommendation: sale entry is started from 107.20, 107.50, 107.80.
- Alternative recommendation: buy entry is started from 106.70, 106.40, 106.00.
The Japanese yen remains in the correction phase on the recovery of the American.
USD CAD (current price: 1.2590)
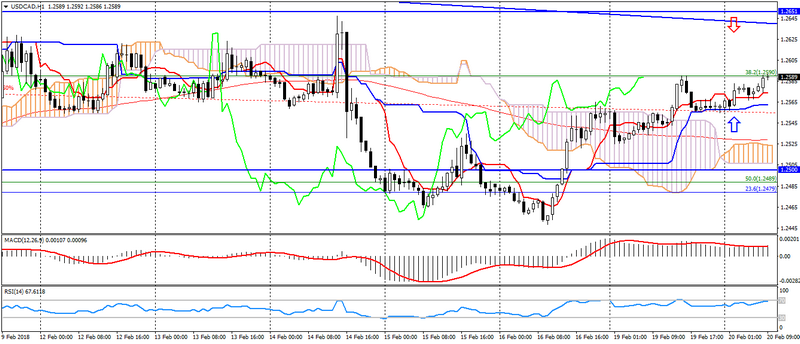
- Support levels: 1.2340.1.2200, 1.2060 (2017 minimum).
- Resistance levels: 1.2500, 1.2650, 1.2770 (August 2017 maximum).
- Computer analysis: MACD (12, 26, 9) (signal – upward movement): the indicator is above 0, the signal line is in the body of the histogram. RSI (14) is in the overbought zone. IchimokuKinkoHyo (9,26,52) (signal – upward movement, flat): the Tenkan-sen line is above the Kijun-sen line, the price is higher than the cloud.
- The main recommendation: sale entry is started from 1.2600, 1.2620, 1.2650.
- Alternative recommendation: buy entry is started from 1.2570, 1.2550, 1.2530.
The Canadian dollar accelerated the decline on the growth of the American, but the pair maintains a common downward trend.
AUD USD (current price: 0.7900)
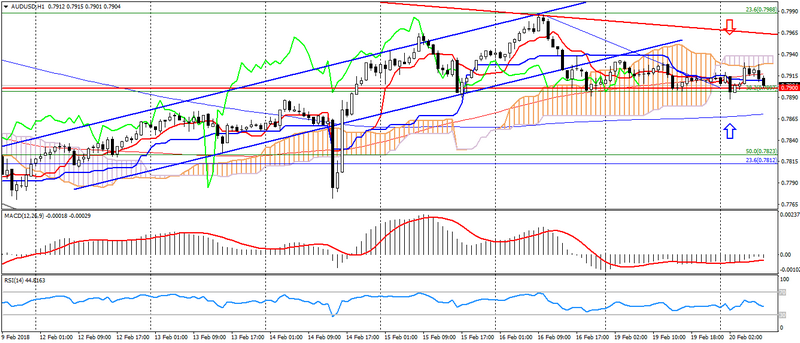
- Support levels: 0.7900, 0.7700 (March 2017 maximum), 0.7500.
- Resistance levels: 0.8120 (2017 maximum), 0.8200, 0.8290 (2014 maximum).
- Computer analysis: MACD (12, 26, 9) (signal – upward movement): the indicator is below 0, the signal line has left the body of the histogram. RSI (14) is in the neutral zone. IchimokuKinkoHyo (9,26,52) (signal – downward movement): the line Tenkan-sen is below the line Kijun-sen, the price is in the cloud.
- The main recommendation: sale entry is started from 0.7940, 0.7960, 0.8000.
- Alternative recommendation: buy entry is started from 0.7890, 0.7860, 0.7840.
The Australian maintains a lateral trend on the possibility of resuming the decline.
NZD USD (current price: 0.7340)
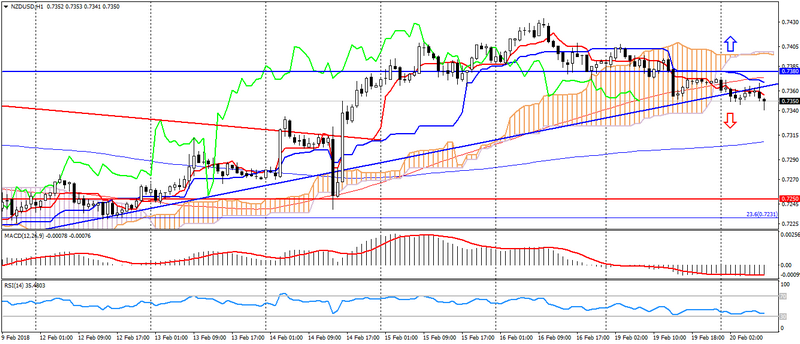
- Support levels: 0.7250, 0.7130 (August 2017 minimum), 0.7000.
- Resistance levels: 0.7380, 0.7450, 0.7550 (2017 maximum).
- Computer analysis: MACD (12, 26, 9) (signal- downward movement): the indicator is below 0, the signal line is in the body of the histogram RSI (14) is in the neutral zone. IchimokuKinkoHyo (9,26,52) (signal – downward movement): the line Tenkan-sen is below the line Kijun-sen, the price is in the cloud.
- The main recommendation: sale entry is started from 0.7360, 0.7380, 0.7410.
- Alternative recommendation: buy entry is started from 0.7330, 0.7300, 0.7280.
The New Zealand dollar has overcome significant support, which may indicate a reversal of the uptrend.
XAU USD (current price: 1337.00)
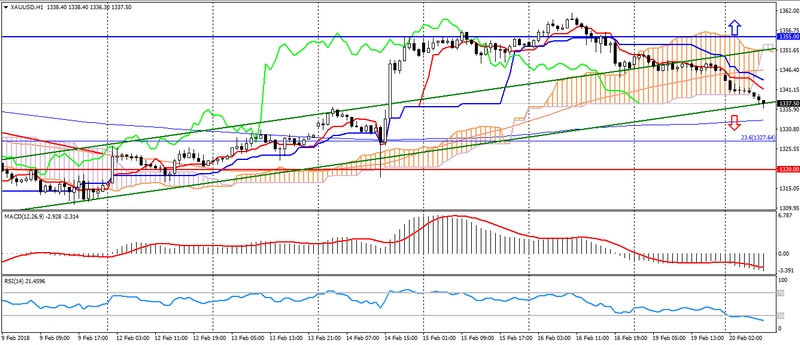
- Support levels: 1320.00, 1303.00, 1280.00.
- Resistance levels: 1355.00 (May May 2016 maximum), 1374.00, 1290.00 (March 2016 maximum).
- Computer analysis: MACD (12, 26, 9) (signal – downward movement): the indicator is below 0, the signal line is in the body of the histogram. RSI (14) is in the oversold zone. IchimokuKinkoHyo (9,26,52) (signal-downward movement): the Tenkan-sen line is below the Kijun-sen line, the price is in the clouds.
- The main recommendation: sale entry is started from 1345.00, 1349.00, 1351.00.
- Alternative recommendation: buy entry is started from 1332.00, 1330.00, 1324.00.
Gold remains in the correction phase due to the repulsion from the highs, still limited to an uptrend.