
Тechnical analysis of currency pairs (Anton Hanzenko)
EUR USD (current price: 1.1870)
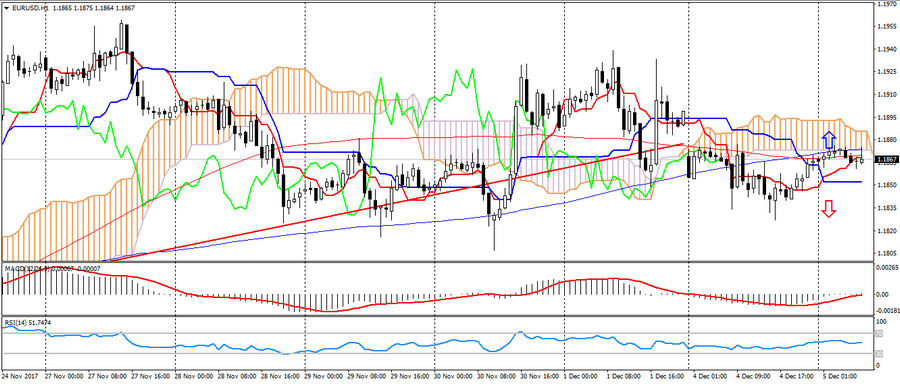
- Support levels: 1.1700 (August 2015 maximum), 1.1600 (2016 maximum), 1.1470.
- Resistance levels: 1.2000, 1.2100, 1.2270 (November 2014 minimum).
- Computer analysis: MACD (12, 26, 9) (signal – downward movement): the indicator is below 0, the signal line is in the body of the histogram. RSI (14) is in the neutral zone. Ichimoku Kinko Hyo (9, 26, 52) (signal – upward movement, flat): the Tenkan-sen line is above the Kijun-sen line, the price is below the cloud.
- The main recommendation: sale entry is started from 1.1880 (MA 200), 1.1900, 1.1930.
- Alternative recommendation: buy entry is started from 1.1840, 1.1820, 1.1800.
The euro is trading within the limits of Monday near the significant resistance of 1.1870, the breakthrough of this level will indicate the closure of the gap. But, along with this, the downward dynamics in the pair persists.
GBP USD (current price: 1.3430)
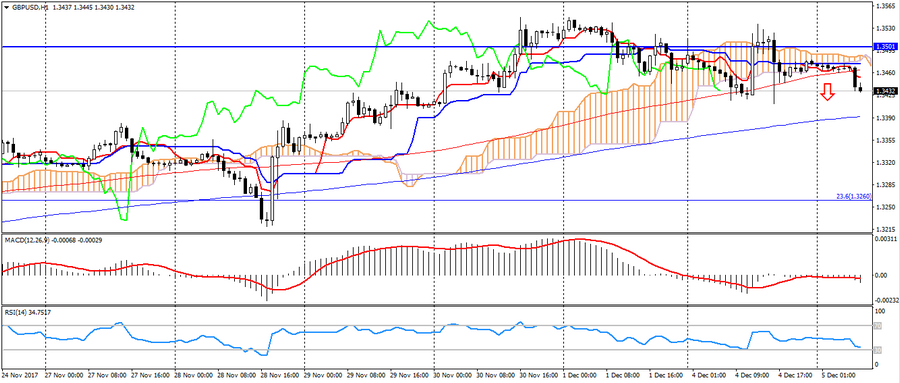
- Support levels: 1.3140, 1.2900, 1.2740 (August 2017 minimum).
- Resistance levels: 1.3500, 1.3660, 1.3830 (February 2016 minimum).
- Computer analysis: MACD (12, 26, 9) (signal – downward movement): the indicator is below 0, the signal line is in the body of the histogram. RSI (14) is in the zone of easy overselling. Ichimoku Kinko Hyo (9, 26, 52) (signal – downward movement): the Tenkan-sen line is below the Kijun-sen line, the price is below the cloud.
- The main recommendation: sale entry is started from 1.3500, 1.3540, 1.3560.
- Alternative recommendation: buy entry is started from 1.3420, 1.3390 (MA 200), 1.3350.
The British pound is also trading with a fall based on growth of the American and the emergence of new disagreements over Brexit, thereby maintaining a correction movement.
USD CHF (current price: 0.9850)
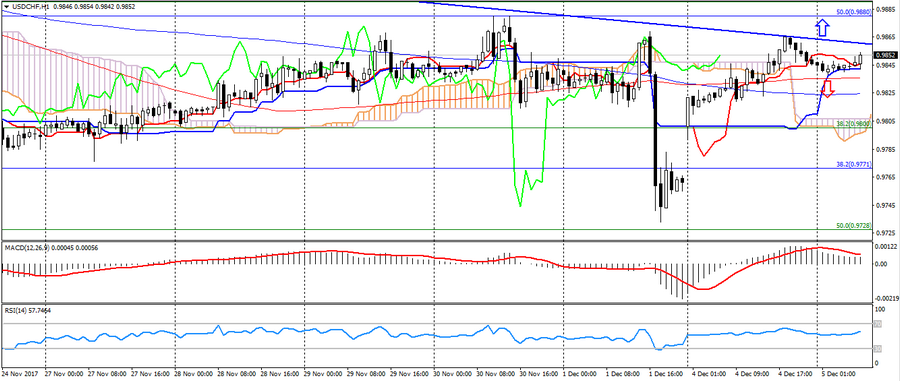
- Support levels: 0.9700, 0.9600, 0.9530.
- Resistance levels: 1.0000, 1.0050, 1.0100 (May maximum).
- Computer analysis: MACD (12, 26, 9) (signal – upward movement): the indicator is above 0, the signal line has left the body of the histogram. RSI (14) is in the neutral zone. Ichimoku Kinko Hyo (9, 26, 52) (signal – upward movement): the Tenkan-sen line is above the Kijun-sen line, the price is higher than the cloud.
- The main recommendation: sale entry is started from 0.9860, 0.9880 (Fibo.50.0 from the high of November 2016), 0.9900.
- Alternative recommendation: buy entry is started from 0.9800, 0.9770 (Fibo, 38.2 from the maximum of November 2016), 0.9750.
The Swiss franc is trading lower, but still maintains an upward trend.
USD JPY (current price: 112.70)
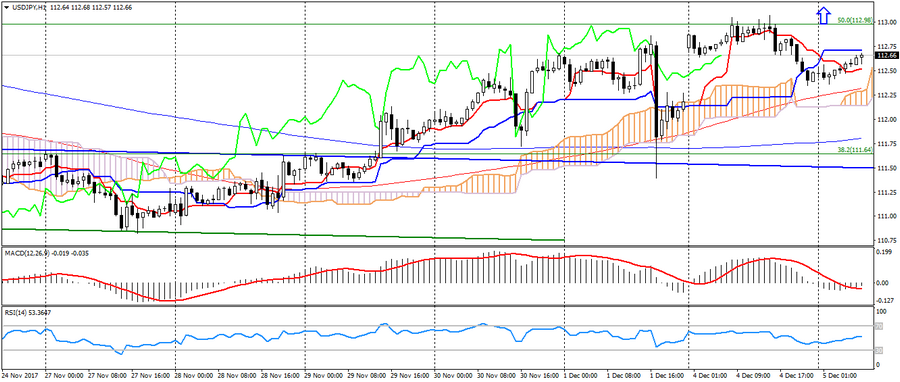
- Support levels: 108.90, 108.10 (April 2017 minimum), 107.30 (2017 minimum).
- Resistance levels: 113.70, 114.50 (July 2017 maximum), 115.00.
- Computer analysis: MACD (12, 26, 9) (signal – upward movement): the indicator is below 0, the signal line has left the body of the histogram. RSI (14) is in the neutral zone. Ichimoku Kinko Hyo (9, 26, 52) (signal – descending movement, flat): the Tenkan-sen line is below the Kijun-sen line, the price is higher than the cloud.
- The main recommendation: sale entry is started from 113.00 (Fibo, 50.0 from the maximum of November 2016), 113.20, 113.50.
- Alternative recommendation: buy entry is started from 112.40, 112.20, 111.60 (Fibo 38.2 from the high of November 2016).
The Japanese yen maintains a downward trend against the American, despite a repulsion from psychology at 113.00.
USD CAD (current price: 1.2660)
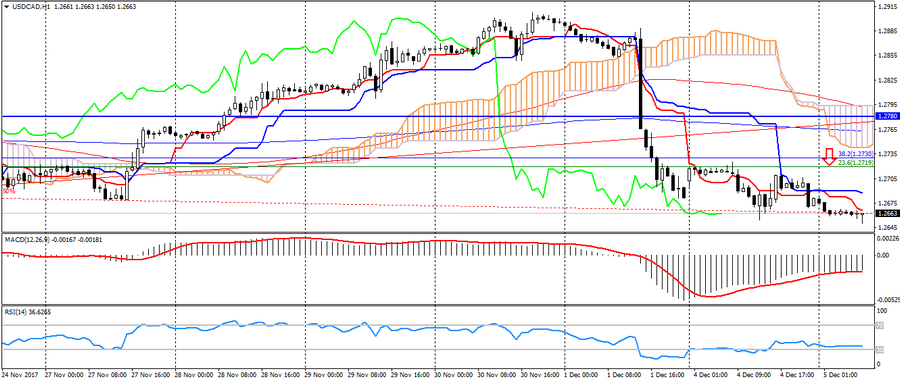
- Support levels: 1.2200, 1.2060 (2017 minimum), 1.1950 (2015 minimum).
- Resistance levels: 1.2780 (August 2017 maximum), 1.3000, 1.3160.
- Computer analysis: MACD (12, 26, 9) (signal – upward movement): the indicator is below 0, the signal line has left the body of the histogram. RSI (14) is in the slight oversold zone. Ichimoku Kinko Hyo (9, 26, 52) (signal – downward movement): the Tenkan-sen line is below the Kijun-sen line, the price is below the cloud.
- The main recommendation: sale entry is started from 1.2700, 1.2730, 1.2760 (MA 200).
- Alternative recommendation: buy entry is started from 1.2650, 1.2630, 1.2600.
The Canadian dollar is trading with strengthening, despite the significant overbought and divergent MACD, which can eventually cause the formation of correction movement.
AUD USD (current price: 0.7640)
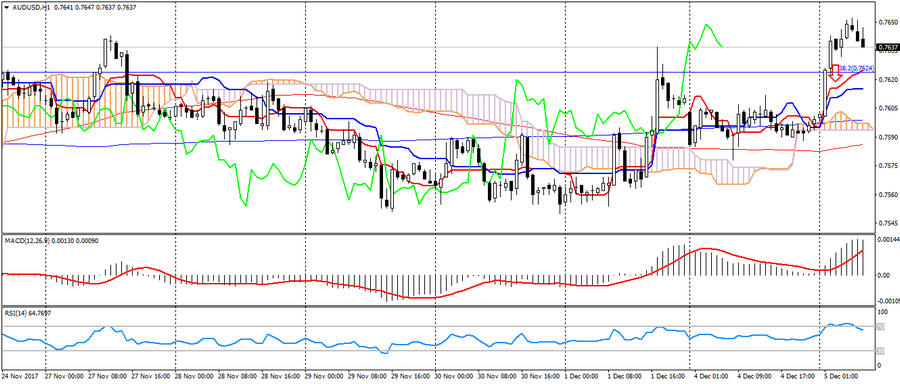
- Support levels: 0.7740, 0.7320 (2017 minimum), 0.7120.
- Resistance levels: 0.8120 (2017 maximum), 0.8200, 0.8290 (2014 maximum).
- Computer analysis: MACD (12, 26, 9) (signal – upward movement): the indicator is above 0, the signal line is in the body of the histogram. RSI (14) is in the neutral zone. Ichimoku Kinko Hyo (9, 26, 52) (signal – upward movement): the Tenkan-sen line is above the Kijun-sen line, the price is higher than the cloud.
- The main recommendation: sale entry is started from 0.7650, 0.7670, 0.7700.
- Alternative recommendation: buy entry is started from 0.7530, 0.7600 (MA 200), 0.7580.
The Australian is trading with a noticeable strengthening based on positive data on Australia and China, but at the same time it is limited to November highs.
NZD USD (current price: 0.6880)
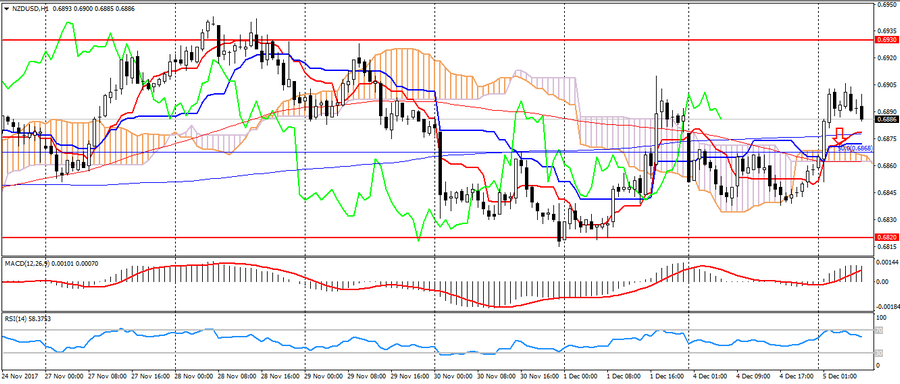
- Support levels: 0.7000, 0.6930, 0.6820 (the minimum of the current year).
- Resistance levels: 0.7380, 0.7450, 0.7550 (2017 maximum).
- Computer analysis: MACD (12, 26, 9) (signal – upward movement): the indicator is above 0, the signal line is in the body of the histogram. RSI (14) is in the neutral zone. Ichimoku Kinko Hyo (9, 26, 52) (signal – upward movement): the Tenkan-sen line is above the Kijun-sen line, the price is higher than the cloud.
- The main recommendation: sale entry is started from 0.6900, 0.6920, 0.6940.
- Alternative recommendation: buy entry is started from 0.6870 (Fibo, 50.0 low August 2015), 0.6840, 0.6820.
The New Zealand dollar also strengthened based on data on China, but the pair is limited to a downward trend.
XAU USD (current price: 1275.00)
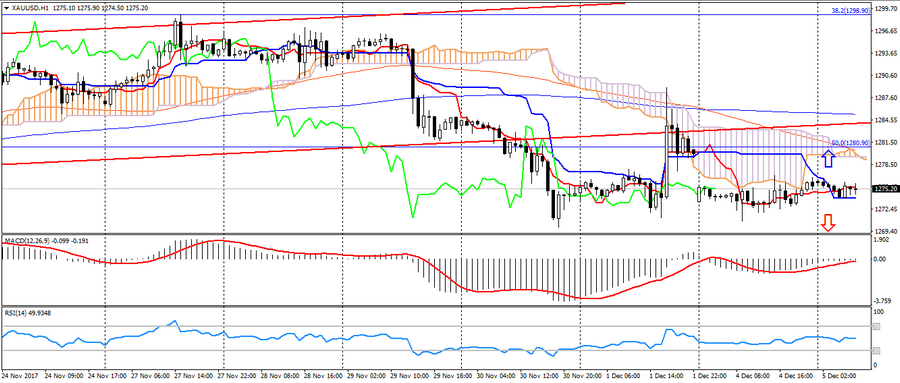
- Support levels: 1250.00, 1226.00, 1200.00.
- Resistance levels: 1340.00, 1355.00, 1374.00 (2016 maximum).
- Computer analysis: MACD (12, 26, 9) (signal – upward movement): the indicator is below 0, the signal line has left the body of the histogram. RSI (14) in the neutral zone. Ichimoku Kinko Hyo (9, 26, 52) (signal – upward movement, flat): the Tenkan-sen line above the Kijun-sen line, the price is below the cloud.
- The main recommendation: sale entry is started from 1279.00, 1281.00 (Fibo 50.0 from the July low), 1285.00 (MA 200).
- Alternative recommendation: buy entry is started from 1272.00, 1269.00, 1267.00.
Gold maintains a restrained dynamics, limited to a lateral trend.