
Тechnical analysis of currency pairs (Anton Hanzenko)
EUR USD (current price: 1.1780)
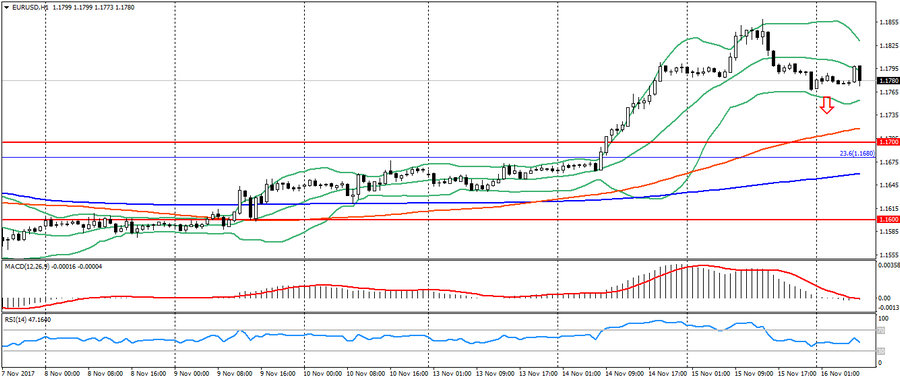
- Support levels: 1.1700 (August 2015 maximum), 1.1600 (2016 maximum), 1.1470.
- Resistance levels: 1.2000, 1.2100, 1.2270 (November 2014 minimum).
- Computer analysis: MACD (signal – downward motion): the indicator is below 0, the signal line is in the body of the histogram. RSI is in the neutral zone. Bollinger Bands (period 20): neutral, declining volatility.
- The main recommendation: sale entry is started from 1.1820, 1.1860, 1.1880.
- Alternative recommendation: buy entry is started from 1.1750, 1.1710 (MA 100), 1.1680 (Fibo. 23.6 from the low of December 2016).
The euro is adjusting after yesterday’s growth, remaining under pressure. An additional factor for sales is the formation of the figure “head and shoulders” on H1.
GBP USD (current price: 1.3150)
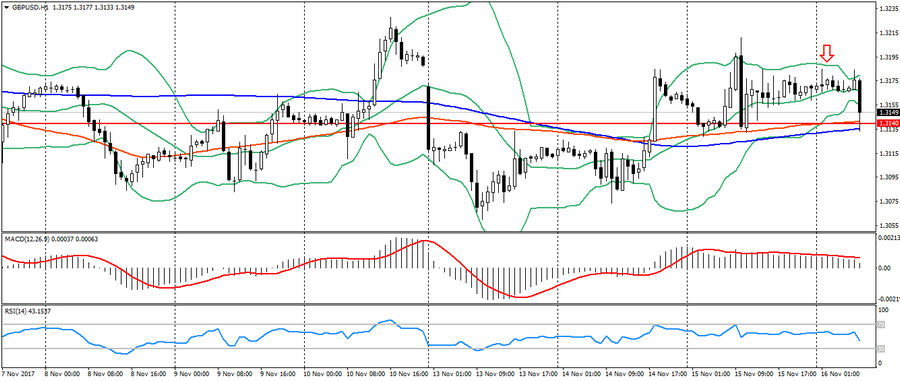
- Support levels: 1.3140, 1.2900, 1.2740 (August 2017 minimum).
- Resistance levels: 1.3500, 1.3660, 1.3830 (February 2016 minimum).
- Computer analysis: MACD (signal – downward motion): the indicator is higher than 0, the signal line has left the body of the histogram. RSI is in the neutral zone. Bollinger Bands (period 20): neutral, declining volatility.
- The main recommendation: sale entry is started from 1.3190, 1.3230, 1.3260 (Fibo, 23.6 from the January low).
- Alternative recommendation: buy entry is started from 1.3160, 1.3140 (MA 200), 1.3090.
The British pound also remains under American pressure, but the main negative movement for the pound is caused by upcoming data on Britain.
USD CHF (current price: 0.9900)
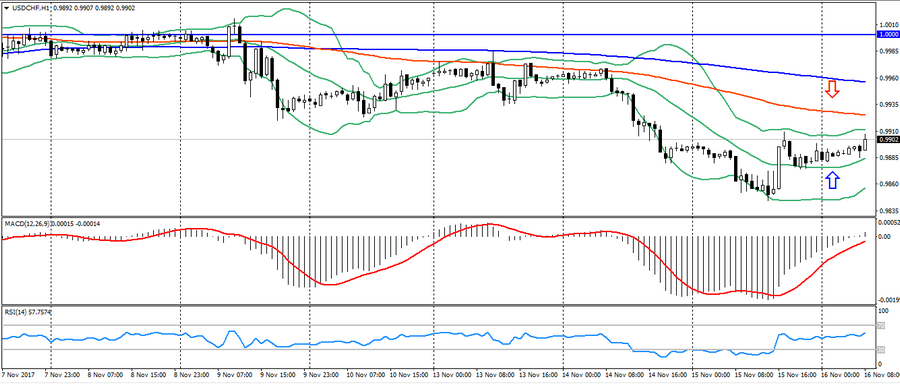
- Support levels: 0.9700, 0.9600, 0.9530.
- Resistance levels: 1.0000, 1.0050, 1.0100 (May maximum).
- Computer analysis: MACD (signal – upward motion): the indicator is below 0, the signal line has left the body of the histogram. RSI is in the neutral zone. Bollinger Bands (period 20): neutral, low volatility.
- The main recommendation: sale entry is started from 0.9920 (MA 100), 0.9960 (MA 200), 1.0000.
- Alternative recommendation: buy entry is started from 0.9860 (MA 200 on H4), 0.9840, 0.9810.
The Swiss franc eased slightly early in the day on a decline in demand for safe assets and a correction of the euro.
USD JPY (current price: 113.20)
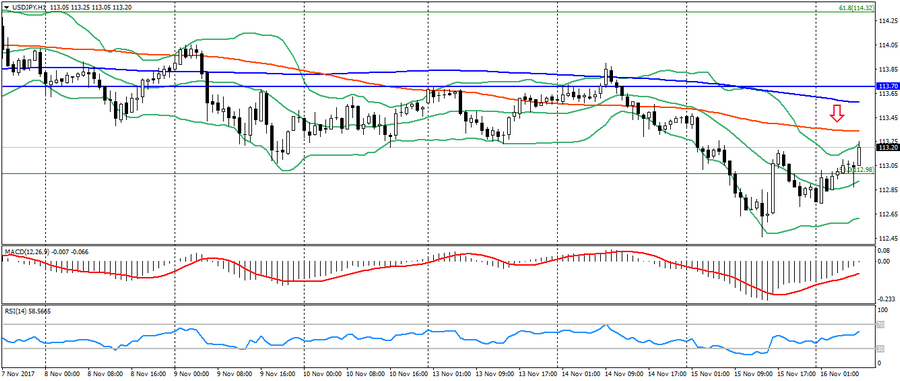
- Support levels: 108.90, 108.10 (April 2017 minimum ), 107.30 (2017 minimum ).
- Resistance levels: 113.70, 114.50 (July 2017 maximum), 115.00.
- Computer analysis: MACD (signal – upward motion): the indicator is below 0, the signal line has left the body of the histogram. RSI is in the neutral zone. Bollinger Bands (period 20): overbought, declining volatility.
- The main recommendation: sale entry is started from 113.30 (MA 100), 113.60 (MA 200), 113.90.
- Alternative recommendation: buy entry is started from 112.70, 112.40, 112.20.
The Japanese yen also eased early in the day because of reduction of the risks and correction of the American, but the pair’s dynamics remains descending.
USD CAD (current price: 1.2760)
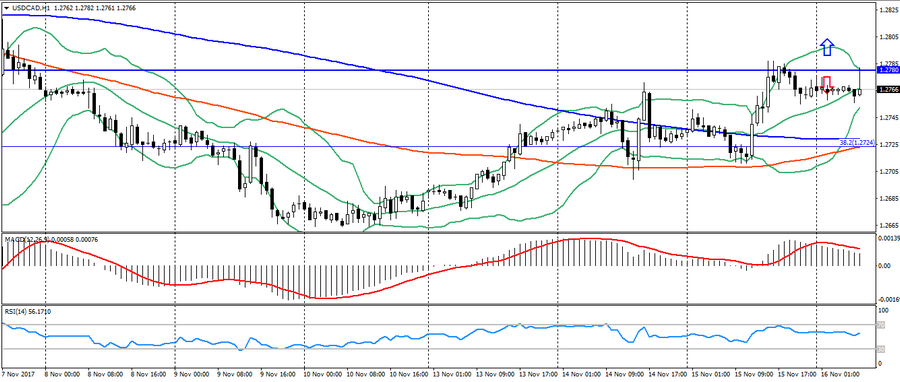
- Support levels: 1.2200, 1.2060 (2017 minimum), 1.1950 (2015 minimum).
- Resistance levels: 1.2780 (August 2017 maximum), 1.3000, 1.3160.
- Computer analysis: MACD (signal – downward motion): the indicator is higher than 0, the signal line has left the body of the histogram. RSI is in the neutral zone. Bollinger Bands (period 20): neutral, low volatility.
- The main recommendation: sale entry is started from 1.2780 (MA 200), 1.2810, 1.2850.
- Alternative recommendation: buy entry is started from 1.2730 (MA 200), 1.2700, 1.2660.
The Canadian dollar remains in flat after yesterday’s decline, limited to the level of 1.2780.
AUD USD (current price: 0.7580)
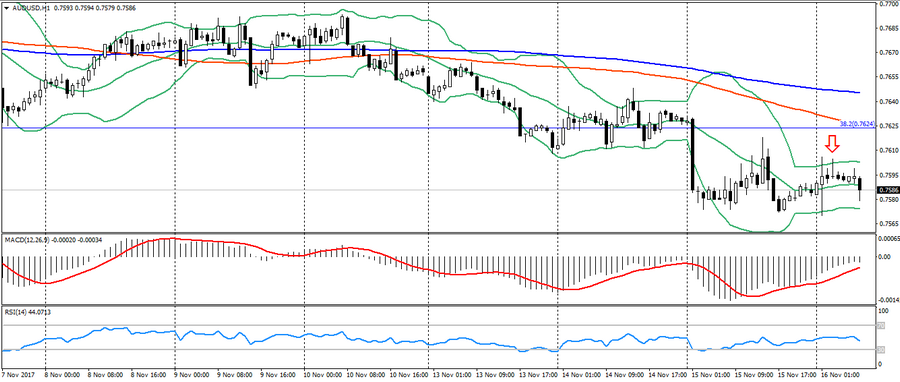
- Support levels: 0.7740, 0.7320 (2017 minimum), 0.7120.
- Resistance levels: 0.8120 (2017 maximum), 0.8200, 0.8290 (2014 maximum).
- Computer analysis: MACD (signal – upward motion): the indicator is below 0, the signal line has left the body of the histogram. RSI is in the neutral zone. Bollinger Bands (period 20): neutral, declining volatility.
- The main recommendation: sale entry is started from 0.7610, 0.7630 (Fibo. 38.2 from the low of 2016), 0.7650 (MA 200).
- Alternative recommendation: buy entry is started from 0.7580, 0.7550, 0.7530.
The Australian is trading in different directions after ambiguous data on employment in Australia.
NZD USD (current price: 0.6580)
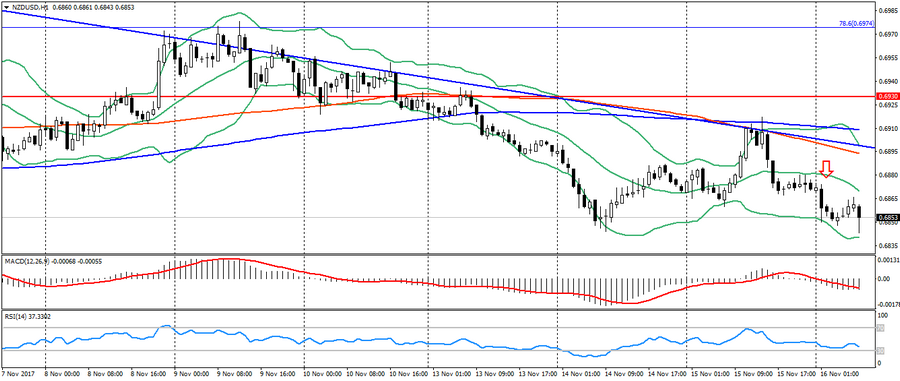
- Support levels: 0.7000, 0.6930, 0.6820 (the minimum of the current year).
- Resistance levels: 0.7380, 0.7450, 0.7550 (2017 maximum).
- Computer analysis: MACD (signal – downward motion): the indicator is below 0, the signal line is in the body of the histogram. RSI is in the neutral zone. Bollinger Bands (period 20): neutral, declining volatility.
- The main recommendation: sale entry is started from 0.6880, 0.6900 (MA 200), 0.6930.
- Alternative recommendation: buy entry is started from 0.6850, 0.6820 (October’s low), 0.6800.
The New Zealand dollar is trading near the lows, waiting for the “head and shoulders” figure to be worked out.
XAU USD (current price: 1276.00)
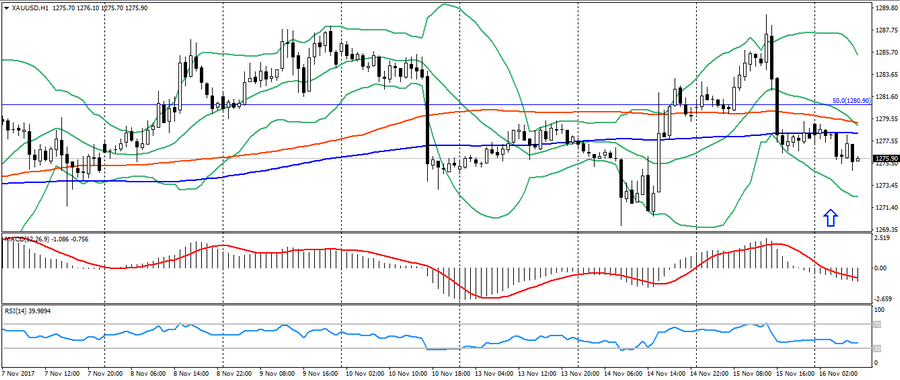
- Support levels: 1250.00, 1226.00, 1200.00.
- Resistance levels: 1340.00, 1355.00, 1374.00 (2016 maximum).
- Computer analysis: MACD (signal – downward motion): the indicator is below 0, the signal line is in the body of the histogram. RSI is in the neutral zone. Bollinger Bands (period 20): neutral, declining volatility.
- The main recommendation: sale entry is started from 1281.00 (Fibo, 50.0 from the July low), 1284.00, 1288.00.
- Alternative recommendation: buy entry is started from 1275.00 (MA 200), 1270.00, 1267.00.
Gold also weakened on the correction of the American, but is limited by the existing upward trend.