
Тechnical analysis of currency pairs (Anton Hanzenko)
EUR USD (current price: 1.1630)
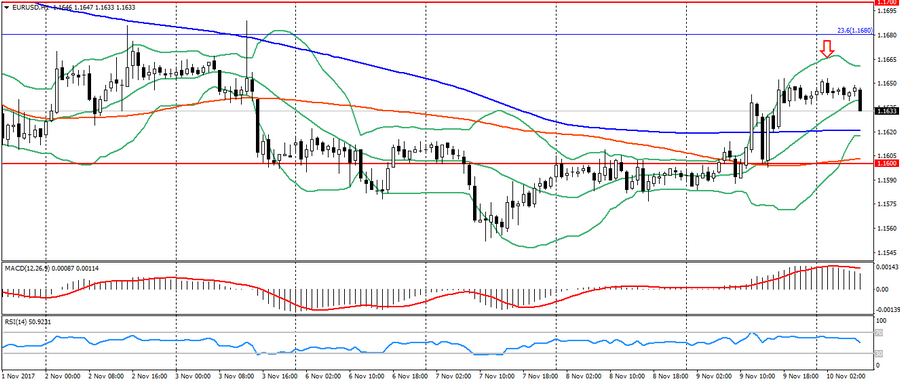
- Support levels: 1.1700 (August 2015 maximum), 1.1600 (2016 maximum), 1.1470.
- Levels of resistance: 1.2000, 1.2100, 1.2270 (November 2014 minimum).
- Computer analysis: MACD (signal – downward motion): the indicator is higher than 0, the signal line has left the body of the histogram. RSI is in the neutral zone. Bollinger Bands (period 20): neutral, growing volatility.
- The main recommendation: sale entry is started from 1.1660, 1.1680 (Fibo, 23.6 from the low of December 2016), 1.1700.
- Alternative recommendation: buy entry is started from 1.1620 (MA 200), 1.1600, 1.1580.
The euro was under pressure at the beginning of the day because of correction after yesterday’s rise, which was caused by the widespread weakening of the American. The pair is in the lateral trend, but with a range extension.
GBP USD (current price: 1.3140)
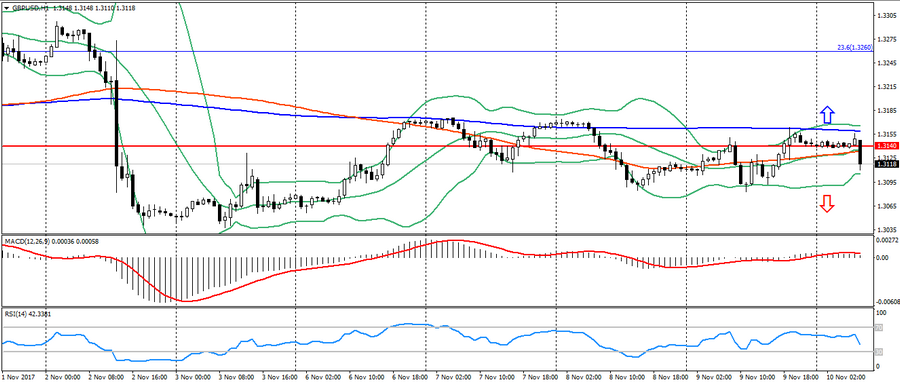
- Support levels: 1.3140, 1.2900, 1.2740 (August 2017 minimum).
- Resistance levels: 1.3500, 1.3660, 1.3830 (February 2016 minimum).
- Computer analysis: MACD (signal – downward motion): the indicator is higher than 0, the signal line has left the body of the histogram. RSI is in the neutral zone. Bollinger Bands (period 20): neutral, growing volatility.
- The main recommendation: sale entry is started from 1.3160 (MA 200), 1.3180, 1.3220.
- Alternative recommendation: buy entry is started 1.3110, 1.3080, 1.3050.
The British pound is also weakened under pressure of the American, but remains in a narrow trading range. This may indicate a rapid breakthrough.
USD CHF (current price: 0.9950)
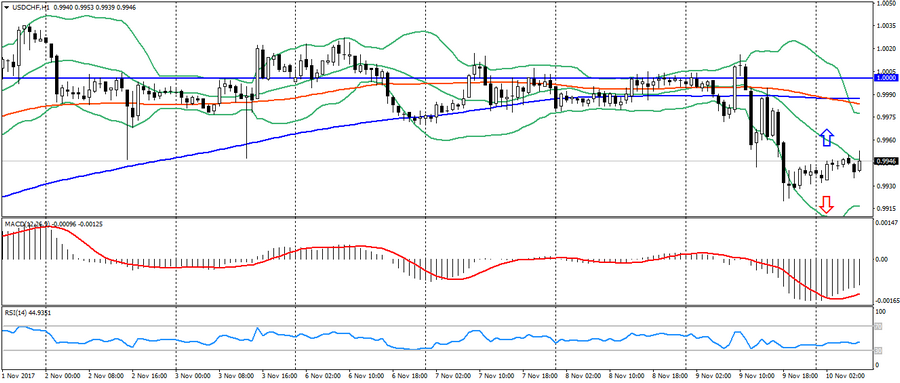
- Support levels: 0.9700, 0.9600, 0.9530.
- Resistance levels: 1.0000, 1.0050, 1.0100 (May maximum).
- Computer analysis: MACD (signal – upward motion): the indicator is below 0, the signal line has left the body of the histogram. RSI is in the neutral zone. Bollinger Bands (period 20): neutral, declining volatility.
- The main recommendation: sale entry is started from 0.9960, 0.9990 (MA 200), 1.0020.
- Alternative recommendation: buy entry is started from 0.9920, 0.9900, 0.9880.
The Swiss franc is also slightly weakened at the beginning of the day, but retains the potential for growth on the uncertainty of the market.
USD JPY (current price: 113.50)
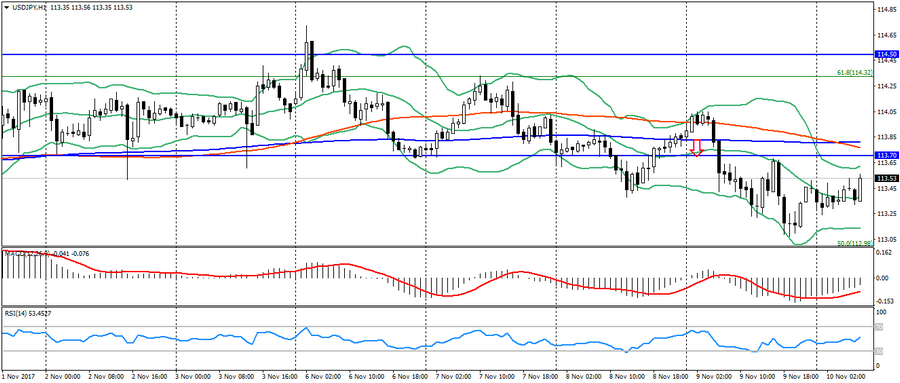
- Support levels: 108.90, 108.10 (April 2017 minimum ), 107.30 (2017 minimum ).
- Resistance levels: 113.70, 114.50 (July 2017 maximum), 115.00.
- Computer analysis: MACD (signal – upward motion): the indicator is below 0, the signal line has left the body of the histogram. RSI is in the neutral zone. Bollinger Bands (period 20): neutral, growing volatility.
- The main recommendation: sale entry is started from 113.50, 113.80 (MA 200), 114.10.
- Alternative recommendation: buy entry is started from 113.10, 112.90 (Fibo. 50.0 from the maximum of December 2016), 112.60.
The Japanese yen is trading lower with the correction of the American and positive signals from the stock indices of China.
USD CAD (current price: 1.2680)
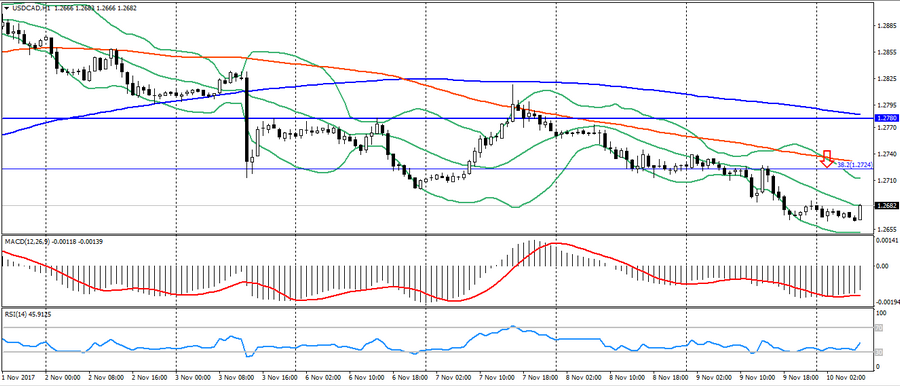
- Support levels: 1.2200, 1.2060 (2017 minimum), 1.1950 (2015 minimum).
- Resistance levels: 1.2780 (August 2017 maximum), 1.3000, 1.3160.
- Computer analysis: MACD (signal – upward motion): the indicator is below 0, the signal line has left the body of the histogram. RSI is in the neutral zone. Bollinger Bands (period 20): neutral, declining volatility.
- The main recommendation: sale entry is started from 1.2700, 1.2730 (MA 100), 1.2750.
- Alternative recommendation: buy entry is started from 1.2650, 1.2610 (MA 200 per H4), 1.2580.
The Canadian dollar maintains an upward trend, despite the US dollar attempts to restore .
AUD USD (current price: 0.7670)
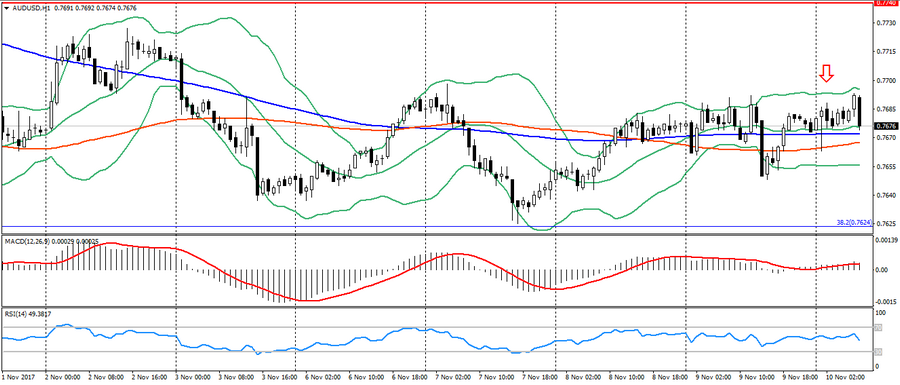
- Support levels: 0.7740, 0.7320 (2017 minimum), 0.7120.
- Resistance levels: 0.8120 (2017 maximum), 0.8200, 0.8290 (2014 maximum).
- Computer analysis: MACD (signal – upward motion): the indicator is above 0, the signal line is in the body of the histogram. RSI is in the neutral zone. Bollinger Bands (period 20): neutral, declining volatility.
- The main recommendation: sale entry is started from 0.7700, 0.7720, 0.7740.
- Alternative recommendation: buy entry is started from 0.7670 (MA 200), 0.7650, 0.7620 (Fibo. 38.2 from the low of January 2016).
The Australian remains under pressure following the RBA’s data aboout reduce of inflation forecast in Australia.
NZD USD (current price: 0.6930)
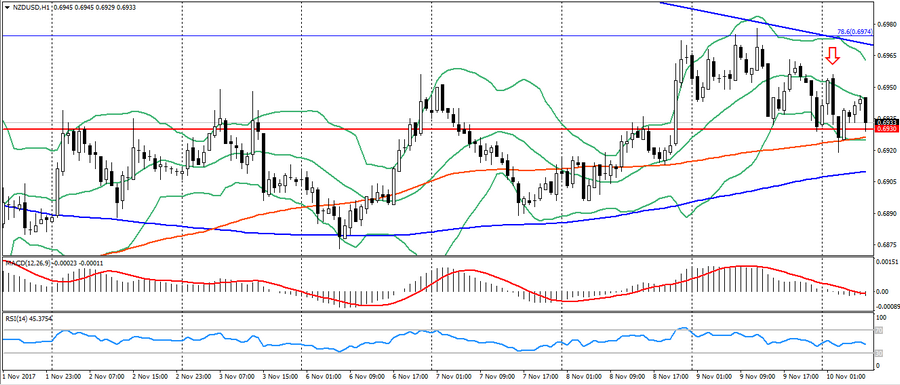
- Support levels: 0.7000, 0.6930, 0.6820 (the minimum of the current year).
- Resistance levels: 0.7380, 0.7450, 0.7550 (2017 maximum).
- Computer analysis: MACD (signal – upward motion): the indicator is above 0, the signal line is in the body of the histogram. RSI is in the neutral zone. Bollinger Bands (period 20): neutral, declining volatility.
- The main recommendation: sale entry is started from 0.6950, 0.6970 (Fibo. 78.6 from the May low), 0.7000.
- Alternative recommendation: buy entry is started from 0.6920 (MA 100), 0.6910 (MA 200), 0.6900.
The New Zealand dollar also weakened on the recovery of the American and the resumption of the downtrend.
XAU USD (current price: 1283.00)
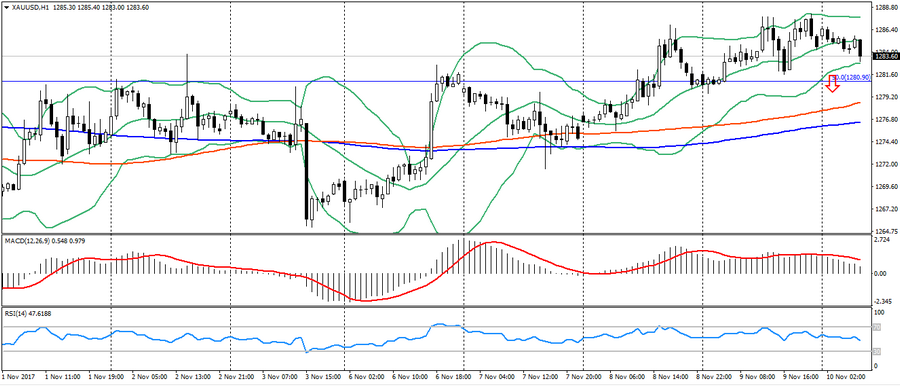
- Support levels: 1250.00, 1226.00, 1200.00.
- Resistance levels: 1340.00, 1355.00, 1374.00 (2016 maximum).
- Computer analysis: MACD (signal – downward motion): the indicator is higher than 0, the signal line has left the body of the histogram. RSI is in the neutral zone. Bollinger Bands (period 20): neutral, low volatility.
- The main recommendation: sale entry is started from 1287.00, 1290.00 (MA200), 1293.00.
- Alternative recommendation: buy entry is started from 1281.00 (Fibo. 50.0 from the July low), 1277.00 (MA 100), 1272.00.
Gold slightly weakened at the beginning of the day, but it keeps the upward trend. The reversal pattern may be formed after the breakthrough of the support level 1281.00.