
Technical Analysis of Oil (Alexander Sivtsov)
Oil is traded near zero marks during the Asian session.
The Brent graph (current price: $ 6459.10 per 100 barrels)
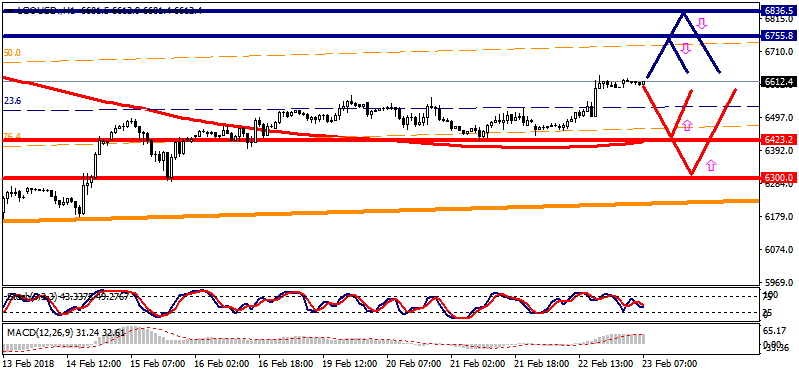
The Brent is traded in a narrow range during the Asian session.
- Resistance 1: From $ 6755.80 (February 7 maximum)
- Resistance 2: From $ 6836.50 (February 5 maximum)
- Support 1: From $ 6423.20 (February 21 minimum)
- Support 2: From $ 6300.00 (psychological level)
Computer analysis: The Stochastic Oscillator movings on the H4 chart indicate overbought of the instrument, there may be a slight decrease in the Brent price.
The WTI graph (current price: $ 6113.10 per 100 barrels)
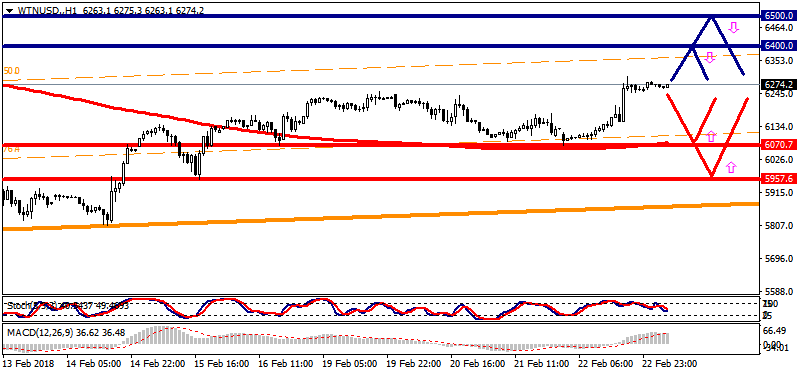
The WTI brand is traded near the zero mark during the Asian session.
- Resistance 1: From $ 6500.00 (psychological level)
- Resistance 2: From $ 6400.00 (psychological level)
- Support 1: From $ 6,070.70 (February 22 minimum)
- Support 2: From $ 5957.60 (February 15 minimum)
Computer analysis: The Stochastic Oscillator movings on the H4 chart indicate overbought of the instrument, so a downward correction of the WTI price is expected.