
Technical Analysis of Oil (Alexander Sivtsov)
Oil is traded below the zero mark in the Asian session.
The Brent graph (current price: $ 6527.20 per 100 barrels)
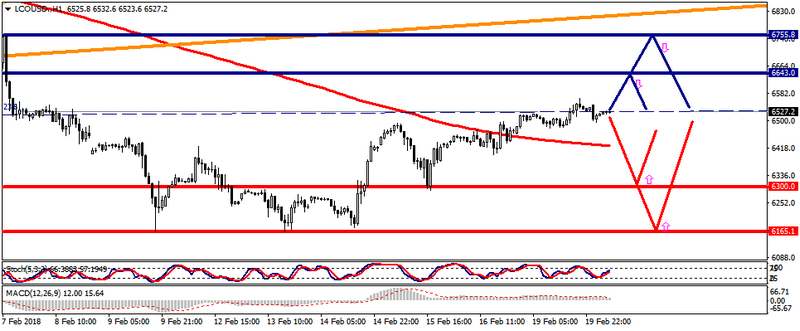
The Brent brand is traded with a minus during the Asian session.
- Resistance 1: From $ 6643.00 (February 6 minimum)
- Resistance 2: From $ 6755.80 (February 7 maximum)
- Support 1: From $ 6300.00 (psychological level)
- Support 2: From $ 6165.10 (February 13 minimum)
Computer analysis: The Stochastic Oscillator movings on the charts of H1 and H4 are in the neutral zone, the continuation of consolidation of the Brent price is possible.
The WTI graph (current price: $ 6214.70 per 100 barrels)
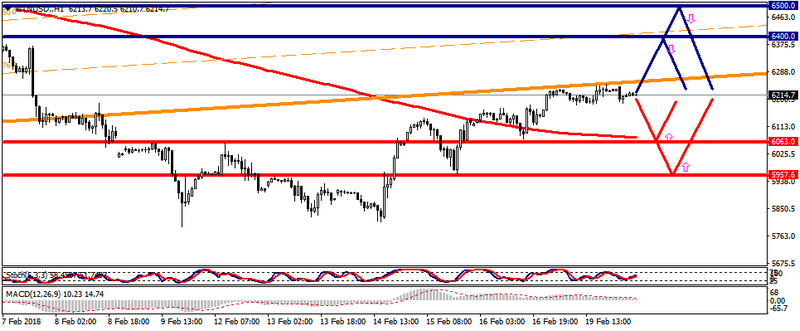
The WTI brand is traded below the zero mark during the Asian session.
- Resistance 1: From $ 6400.00 (psychological level)
- Resistance 2: From $ 6500.00 (psychological level)
- Support 1: From $ 6063.00 (technical level)
- Support 2: From $ 5957.60 (February 15 minimum)
Computer analysis: The Stochastic Oscillator movings on the charts of H1 and H4 are in the neutral zone, so one should expect the WTI price to move in a narrow range.