
Технічний аналіз нафти (Олександр Сівцов)
Нафта торгується вище нульових позначок в ході Азіатської сесії.
Графік марки Brent (поточна ціна: $ 6487.10 за 100 барелів)
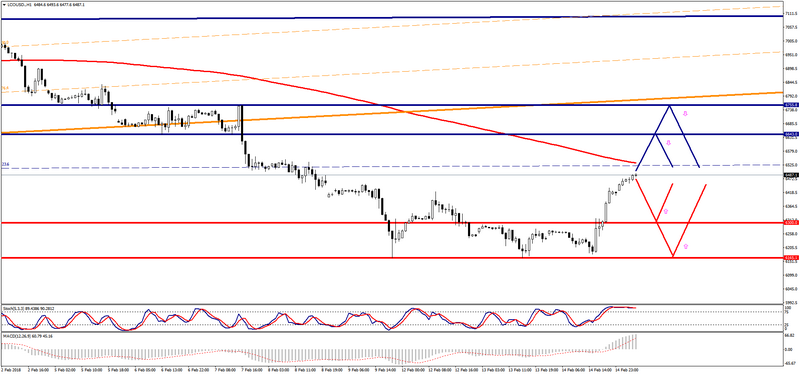
Марка Brent торгується з плюсом в ході Азіатської сесії.
- Опір 1: С $ 6643.00 (мінімум 6 лютого)
- Опір 2: З $ 6755.80 (максимум 7 лютого)
- Підтримка 1: С $ 6300.00 (психологічний рівень)
- Підтримка 2: З $ 6165.00 (мінімум 13 лютого)
Комп’ютерний аналіз: мувінги Stochastic Oscillator на графіках Н1 та Н4 вказують на перекупленність інструменту, на тлі чого можлива спадна корекція ціни марки Brent.
Графік марки WTI (поточна ціна: $ 6132.80 за 100 барелів)
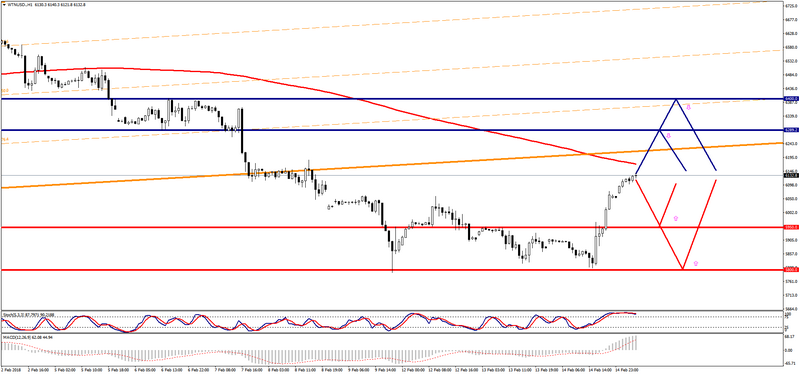
Марка WTI веде торги вище нульової позначки в ході Азіатської сесії.
- Опір 1: С $ 6289.20 (мінімум 6 лютого)
- Опір 2: З $ 6400.00 (психологічний рівень)
- Підтримка 1: С $ 5950.00 (технічний рівень)
- Підтримка 2: З $ 5800.00 (психологічний рівень)
Комп’ютерний аналіз: мувінги Stochastic Oscillator на графіках Н1 та Н4 вказують на перекупленність інструменту, в зв’язку з чим варто очікувати деякого зниження ціни WTI.