
Technical Analysis of Oil (Alexander Sivtsov)
Oil shows mixed dynamics during the Asian session.
The Brent graph (current price: $ 6474.70 per 100 barrels)
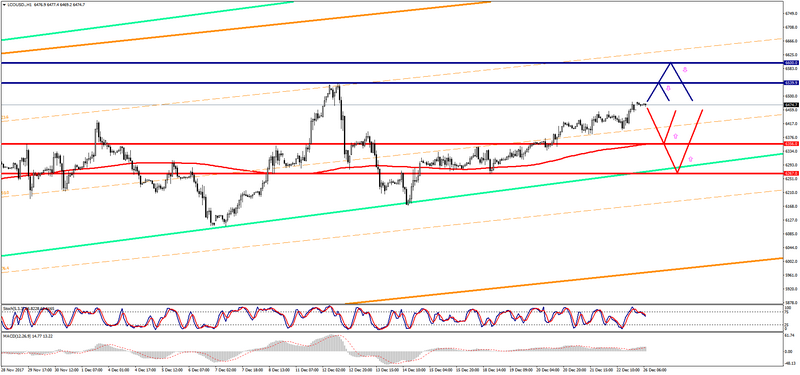
The Brent graph is trading just below the zero mark during the Asian session.
- Resistance 1: From $ 6539.90 (December 12 maximum)
- Resistance 2: From $ 6600.00 (psychological level)
- Support 1: From $ 6356.00 (MA 200 on H1)
- Support 2: From $ 6267.00 (December 18 minimum)
Computer analysis: The movings Stochastic Oscillator on the charts of H4 and D1 indicate overbought of the instrument, one should expect a certain reduction in the Brent price.
The WTI graph (current price: $ 5851.20 per 100 barrels)
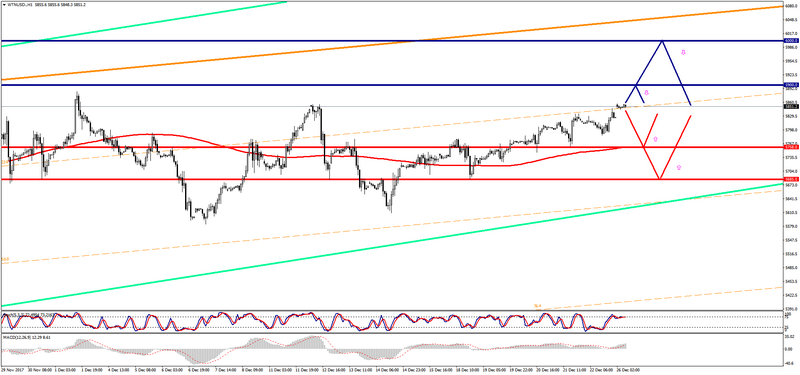
The WTI brand is trading with a small plus during the Asian session.
- Resistance 1: From $ 5900.00 (psychological level)
- Resistance 2: From $ 6000.00 (psychological level)
- Support 1: From $ 5758.00 (MA 200 on H1)
- Support 2: From $ 5685.00 (December 12 minimum)
Computer analysis: The movings Stochastic Oscillator on the charts of H4 and D1 indicate overbought of the instrument, which is why a slight reduction in the WTI price is possible.