
Technical Analysis of Oil (Alexander Sivtsov)
Oil is trading below the zero mark in the Asian session.
The Brent graph (current price: $ 6307.00 per 100 barrels)
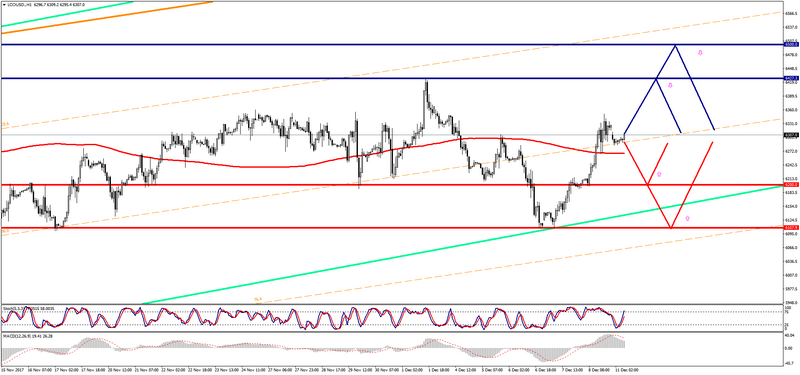
The Brent brand is trading just below the zero mark during the Asian session.
- Resistance 1: From $ 6427.30 (December 1 maximum)
- Resistance 2: From $ 6500.00 (psychological level)
- Support 1: From $ 6200.00 (psychological level)
- Support 2: From $ 6107.90 (December 7 minimum)
Computer analysis: The Stochastic Oscillator movings on the D1 chart are in the neutral zone, that is why the consolidation of the Brent price is possible.
The WTI graph (current price: $ 5724.40 per 100 barrels)
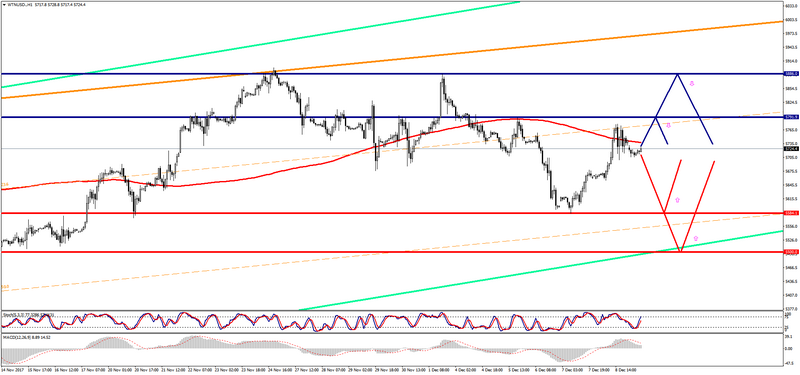
The WTI brand is trading with a small minus during the Asian session.
- Resistance 1: From $ 5791.90 (December 5 maximum)
- Resistance 2: From $ 5886.00 (December 1 maximum)
- Support 1: From $ 5584.10 (December 7 minimum)
- Support 2: From $ 5500.00 (psychological level)
Computer analysis: The Stochastic Oscillator movings on the charts H4 and D1 are in the neutral zone, which is why the consolidation of the WTI price is possible.