
Technical Analysis of Oil (Alexander Sivtsov)
Oil shows a positive trend during the Asian session.
The Brent graph (current price: $ 6279.80 per 100 barrels)

The Brent brand is trading above the zero mark during the Asian session.
- Resistance 1: From $ 6416.50 (November 10 maximum)
- Resistance 2: From $ 6500.00 (psychological level)
- Support 1: From $ 6200.00 (psychological level)
- Support 2: From $ 6100.00 (psychological level)
Computer analysis: The Stochastic Oscillator movings on the charts of H4 and D1 are in the neutral zone, against which the formation of the consolidation of the Brent price in anticipation of the results of the OPEC summit is possible.
The WTI graph (current price: $ 5749.50 per 100 barrels)
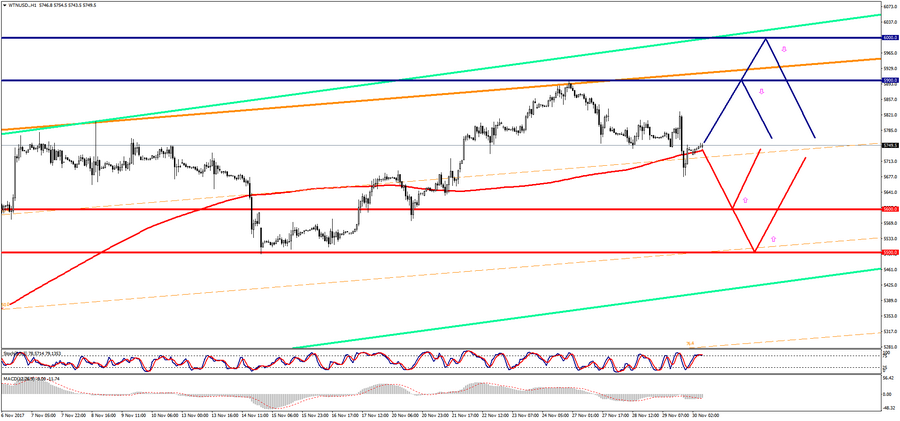
The WTI brand is trading with a minus during the Asian session.
- Resistance 1: From $ 5900.00 (psychological level)
- Resistance 2: From $ 6000.00 (psychological level)
- Support 1: From $ 5600.00 (psychological level)
- Support 2: From $ 5500.00 (psychological level)
Computer analysis: The Stochastic Oscillator movings on the charts of H4 and D1 are in the neutral zone, against which the formation of the consolidation of the WTI price in anticipation of the results of the OPEC summit is possible.