
Technical Analysis of Oil (Alexander Sivtsov)
Oil is trading below the zero mark in the Asian session.
Brent graph (current price: $ 6287.20 per 100 barrels)
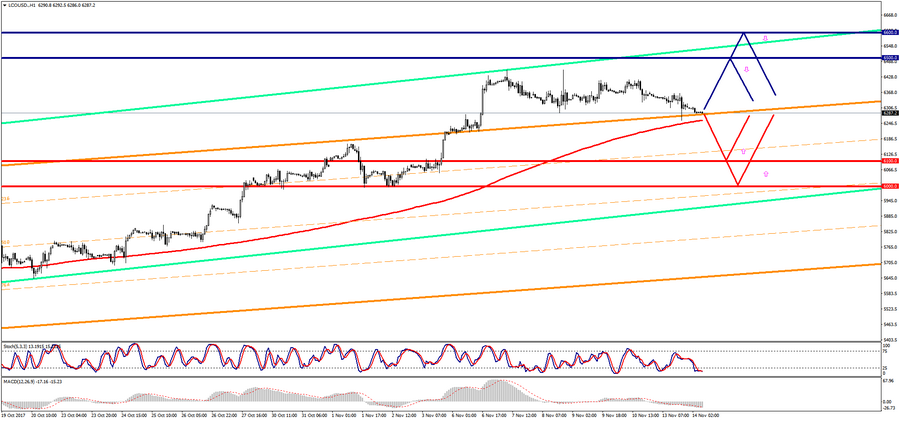
The Brent oil is trading below the zero mark during the Asian session.
- Resistance 1: From $ 6500.00 (psychological level)
- Resistance 2: From $ 6600.00 (psychological level)
- Support 1: From $ 6100.00 (psychological level)
- Support 2: From $ 6200.00 (psychological level)
Computer analysis: The Stochastic Oscillator movings on the H1 chart indicate oversold of the instrument. One should expect some recovery of the Brent price.
WTI graph (current price: $ 5676.50 per 100 barrels)
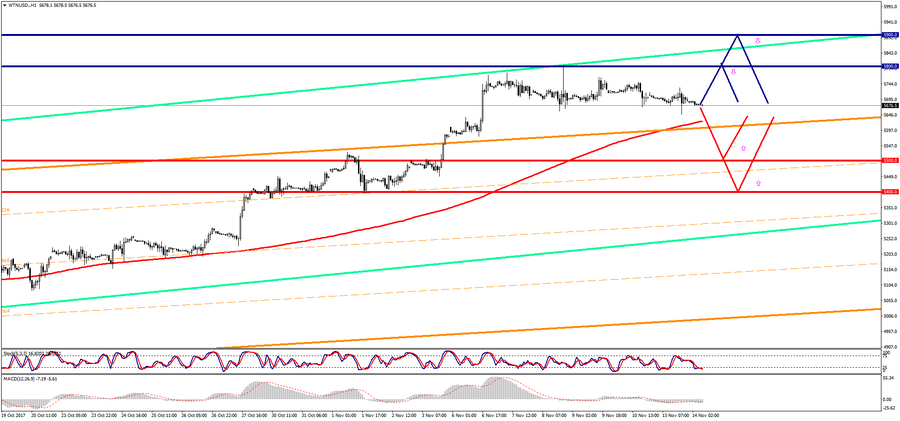
The WTI brand is trading with a small minus during the Asian session.
- Resistance 1: From $ 5800.00 (psychological level)
- Resistance 2: From $ 5900.00 (psychological level)
- Support 1: From $ 5500.00 (psychological level)
- Support 2: From $ 5400.00 (psychological level)
Computer analysis: The Stochastic Oscillator movings on the H1 chart indicate oversold, which may allow some recovery in the price of WTI oil.