
Technical Analysis of Oil (Alexander Sivtsov)
Oil is traded above the zero mark in the Asian session.
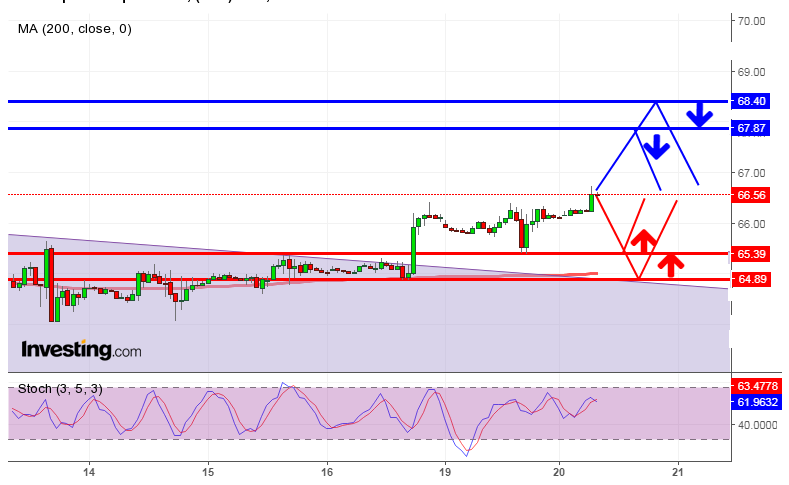
The Brent graph (current price: $ 66.56)
Brand Brent is traded above the zero mark during the Asian session.
- Resistance 1: From $ 67.87 (February 28 maximum)
- Resistance 2: From $ 68.40 (technical level)
- Support 1: From $ 65.39 (March 19 minimum)
- Support 2: From $ 64.89 (March 16 minimum)
Computer analysis: The Stochastic Oscillator movings on the chart H1 are in the neutral zone, against which the continuation of the Brent price movement in a narrow range is possible.
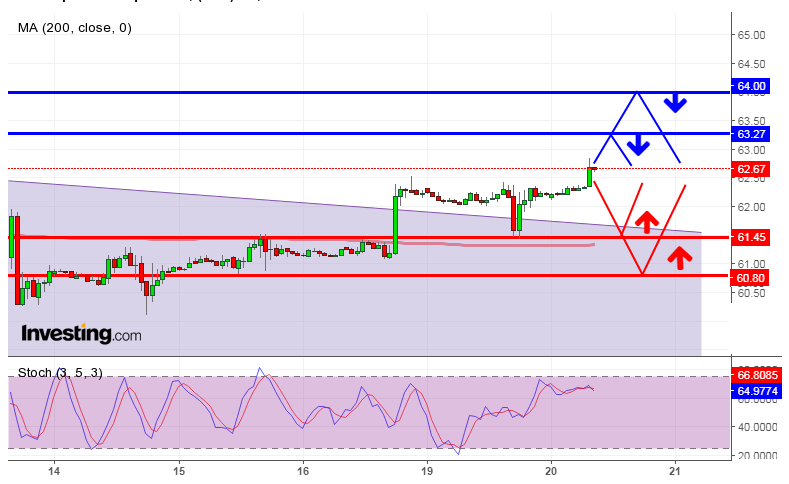
The WTI graph (current price: $ 62.67)
Brand WTI is traded with a plus during the Asian session.
- Resistance 1: From $ 63.27 (March 6 maximum)
- Resistance 2: From $ 64.00 (psychological level)
- Support 1: From $ 61.45 (March 19 minimum)
- Support 2: From $ 60.80 (technical level)
Computer analysis: The Stochastic Oscillator movings on the H1 chart are in the neutral zone, in connection with which one should expect the continuation of the WTI price consolidation.