
Технический анализ нефти (Александр Сивцов)
Нефть торгуется ниже нулевых отметок в ходе Азиатской сессии.
График марки Brent (текущая цена: $6298.40 за 100 баррелей)
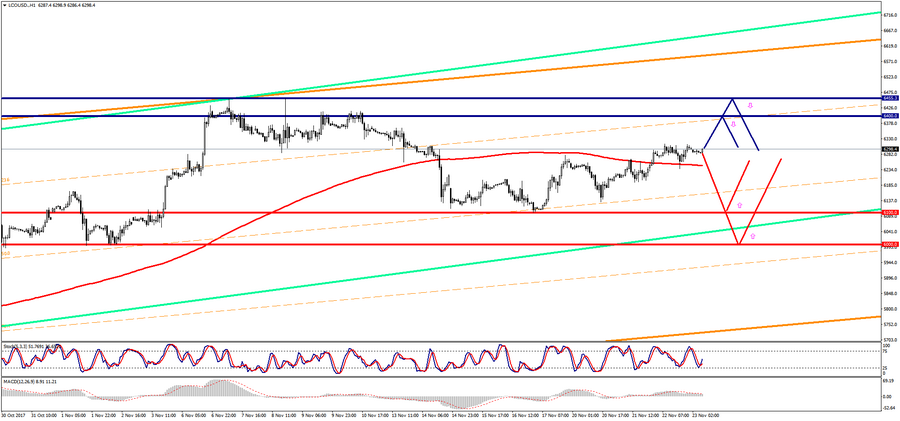
Марка Brent торгуется ниже нулевой отметки в ходе Азиатской сессии.
- Сопротивление 1: С$6400.00 (психологический уровень)
- Сопротивление 2: С$6455.30 (максимум 8 ноября)
- Поддержка 1: С$6100.00 (психологический уровень)
- Поддержка 2: С$6000.00 (психологический уровень)
Компьютерный анализ: Мувинги Stochastic Oscillator на графике Н4 указывают на перекупленость инструмента, на фоне чего возможно снижение цены марки Brent.
График марки WTI (текущая цена: $5791.40 за 100 баррелей)
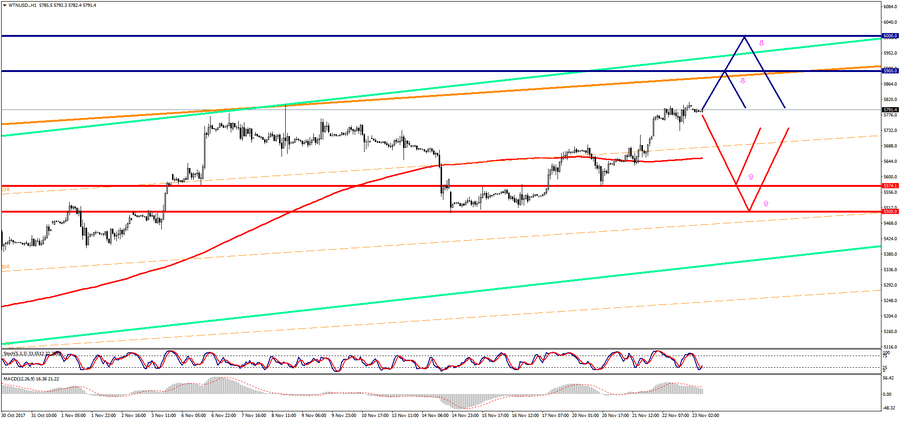
Марка WTI ведет торги с минусом в ходе Азиатской сессии.
- Сопротивление 1: С$5900.00 (психологический уровень)
- Сопротивление 2: С$6000.00 (психологический уровень)
- Поддержка 1: С$5574.10 (минимум 20 ноября)
- Поддержка 2: С$5500.00 (психологический уровень)
Компьютерный анализ: Мувинги Stochastic Oscillator на графике Н4 указывают на перекупленость инструмента, в связи с чем возможна понижательная коррекция цены марки WTI.