
Technical Analysis of Oil (Alexander Sivtsov)
Oil is traded below the zero mark in the Asian session.
The Brent graph (current price: $ 6422.80 per 100 barrels)
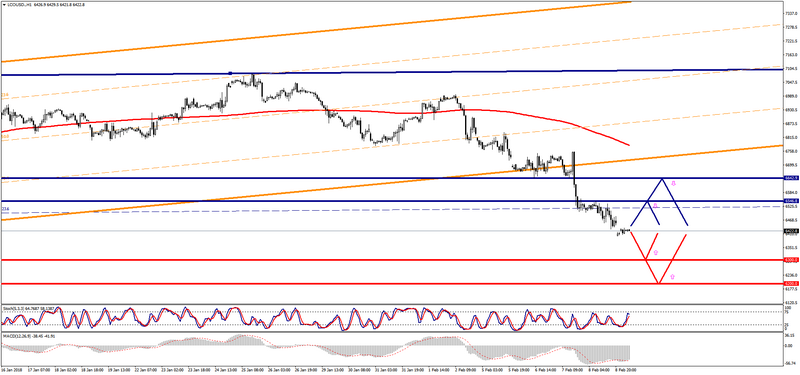
The Brent brand is traded below the zero mark during the Asian session.
- Resistance 1: From $ 6546.80 (February 8 maximum)
- Resistance 2: From $ 6642.90 (February 6 minimum)
- Support 1: From $ 6300.00 (psychological level)
- Support 2: From $ 6200.00 (psychological level)
Computer analysis: The Stochastic Oscillator movings on the H4 chart indicate the oversold of the instrument. The upward correction of the Brent price is possible.
The WTI graph (current price: $ 6033.80 per 100 barrels)

The WTI brand is traded with a minus during the Asian session.
- Resistance 1: From $ 6186.50 (February 8 maximum)
- Resistance 2: From $ 6289.20 (minimum Feb. 6)
- Support 1: From $ 5931.10 (December 27 minimum)
- Support 2: From $ 5855.80 (December 12 maximum)
Computer analysis: The Stochastic Oscillator movings on the H4 chart indicate oversold of the instrument, which is why one should expect some recovery of the WTI price in anticipation of data on the number of drilling rigs in the US.