
Technical Analysis of Oil (Alexander Sivtsov)
Oil is traded near zero marks during the Asian session.
The Brent graph (current price: $ 6910.30 per 100 barrels)
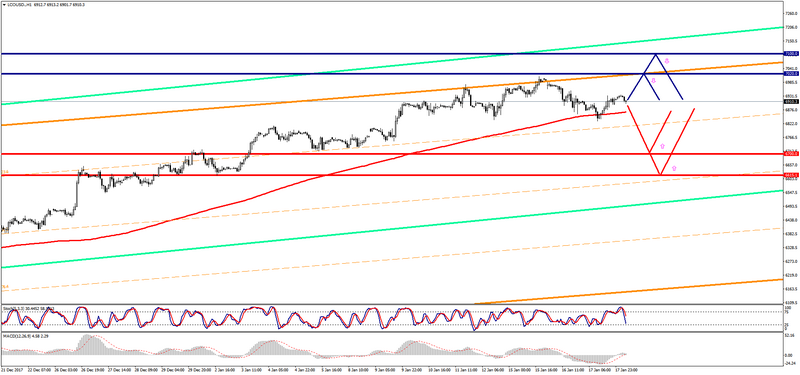
The Brent brand is traded near the zero mark during the Asian session.
- Resistance 1: With $ 7020.00 (resistance line of Up channel on H4)
- Resistance 2: From $ 7100.00 (psychological level)
- Support 1: From $ 6700.00 (psychological level)
- Support 2: From $ 6615.10 (January 2 minimum)
Computer analysis: The Stochastic Oscillator movings on the H4 chart indicate overbought of the instrument, so there may be some reduction in the Brent price in anticipation of data on oil reserves in the US.
The WTI graph (current price: $ 6391.10 per 100 barrels)
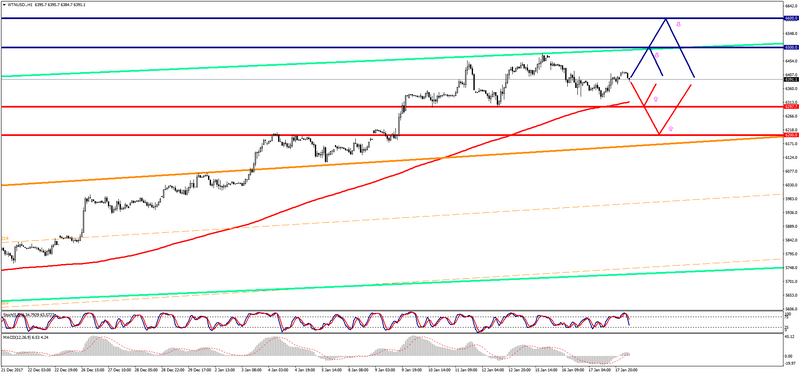
The WTI brand is traded near the zero mark during the Asian session.
- Resistance 1: From $ 6500.00 (psychological level)
- Resistance 2: From $ 6600.00 (psychological level)
- Support 1: From $ 6297.70 (January 12 minimum)
- Support 2: From $ 6200.00 (psychological level)
Computer analysis: The Stochastic Oscillator movings on the H4 chart indicate an overbought of the instrument, which is why there may be some reduction in the price of WTI.