
Technical Analysis of Oil (Alexander Sivtsov)
Oil is trading above the zero mark during the Asian session.
The Brent graph (current price: $ 6532.60 per 100 barrels)
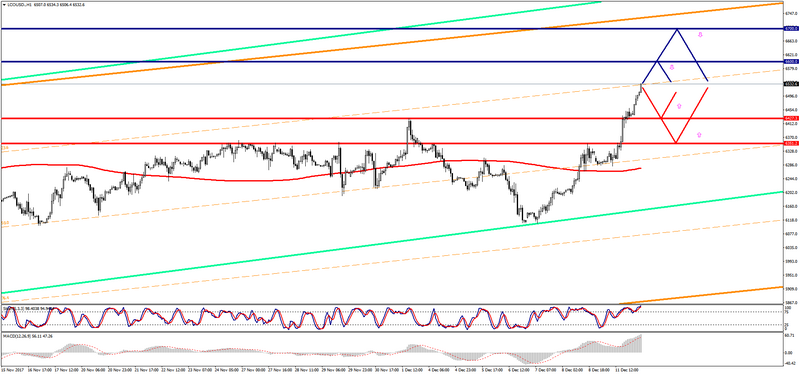
The Brent brand is trading above the zero mark during the Asian session.
- Resistance 1: From $ 6600.00 (December 1 maximum)
- Resistance 2: From $ 6700.00 (psychological level)
- Support 1: From $ 6427.30 (December 1 maximum)
- Support 2: From $ 6351.20 (December 8 maximum)
Computer analysis: The Stochastic Oscillator movings on the charts H1 and H4 indicate overbought of the instrument. That is why there may be some correction of the Brent price.
The WTI graph (current price: $ 5844.80 per 100 barrels)
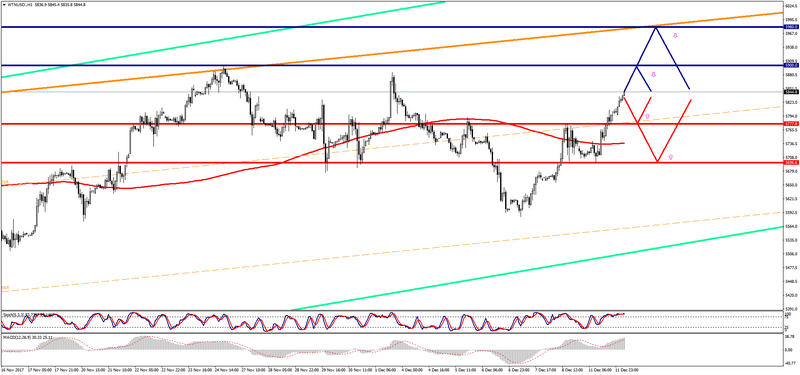
The WTI brand is trading with a plus during the Asian session.
- Resistance 1: From $ 5900.00 (psychological level)
- Resistance 2: From $ 5980.00 (resistance line of up channel on H4)
- Support 1: From $ 5777.80 (December 8 maximum)
- Support 2: From $ 5696.60 (December 11 minimum)
Computer analysis: The Stochastic Oscillator movings on the charts H1 and H4 indicate overbought of the instrument. That is why the correction of the WTI price is possible, in anticipation of data on oil reserves in the US.