
Technical analysis of gold and silver (Alexander Sivtsov)
Gold chart (current price: $ 1353.41)
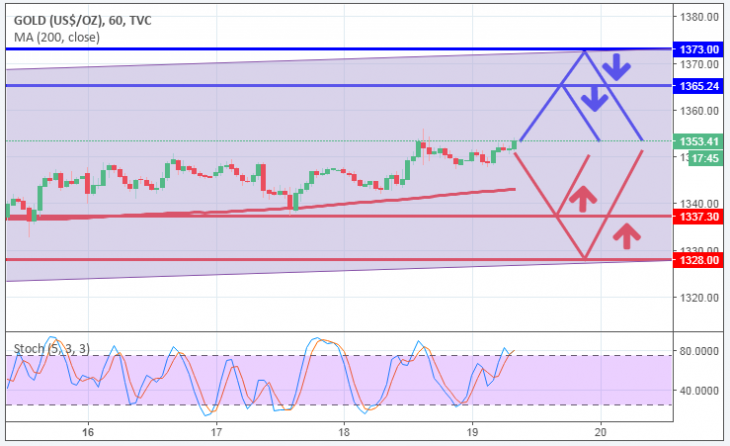
Gold is traded at above the zero mark during the Asian session.
- Resistance 1: From $ 1365.24 (April 11 maximum)
- Resistance 2: From $ 1373.00 (resistance line of Up channel on H1)
- Support 1: From $ 1337.30 (April 17 minimum)
- Support 2: From $ 1328.00 (support line of Up Channel on H1)
Computer analysis: The Stochastic Oscillator movings on the chart H1 are included in the oversold zone, against which the reduction in the price of gold is possible.
Silver chart (current price: $ 17.253)
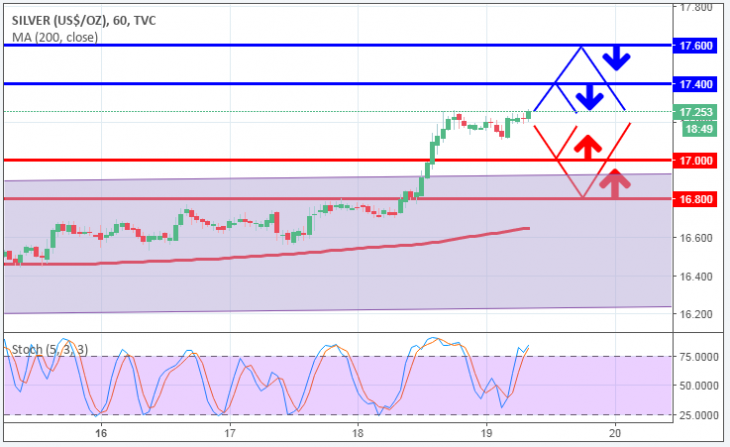
Silver is traded with a plus during the Asian session.
- Resistance 1: From $ 17.40 (technical level)
- Resistance 2: From $ 17.60 (technical level)
- Support 1: From $ 17.00 (psychological level)
- Support 2: From $ 16.80 (technical level)
Computer analysis: The Stochastic Oscillator movings on the chart H1 are included in the oversold zone, against which there may be a decrease in the price of silver.