Technical analysis of gold and silver (Alexander Sivtsov)
Gold chart (current price: $ 1314.50)
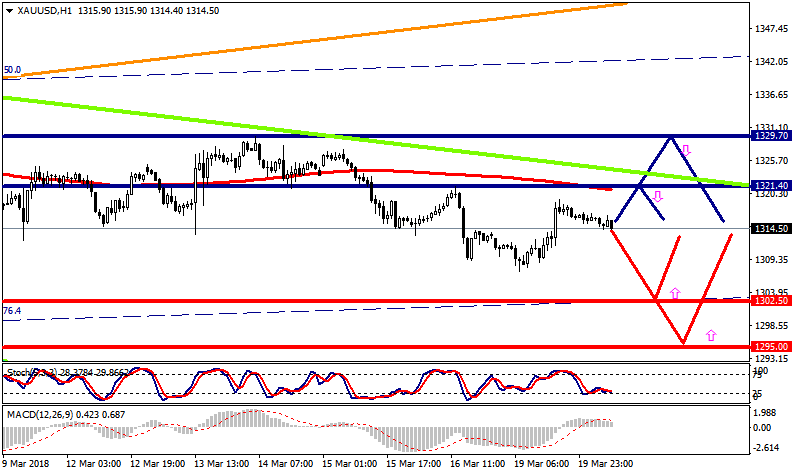
Gold is traded below the zero mark during the Asian session.
- Resistance 1: From $ 1321.40 (March 16 maximum)
- Resistance 2: From $ 1329.70 (March 14 maximum)
- Support 1: From $ 1302.50 (March 1 minimum)
- Support 2: From $ 1295.00 (technical level)
Computer analysis: The Stochastic Oscillator movings on the H4 chart indicate overbought of the instrument, against which one should expect a decrease in the price of gold in the second half of the trades.
Silver chart (current price: $ 16.27)
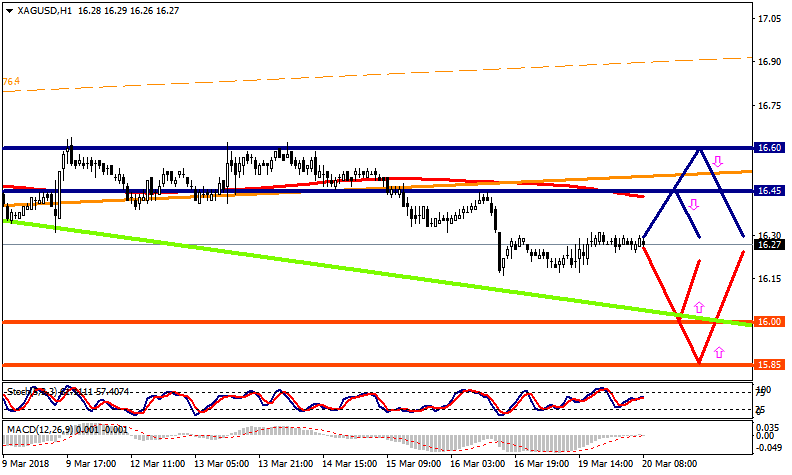
Silver is traded with a minus during the Asian session.
- Resistance 1: From $ 16.45 (March 16 maximum)
- Resistance 2: From $ 16.60 (technical level)
- Support 1: From $ 16.00 (psychological level)
- Support 2: From $ 15.85 (technical level)
Computer analysis: The Stochastic Oscillator movings on the chart of H1 indicate overbought of the instrument, against which a reduction in the price of silver is possible.