Technical analysis of gold and silver (Alexander Sivtsov)
Gold Chart (current price: $ 1322.10)
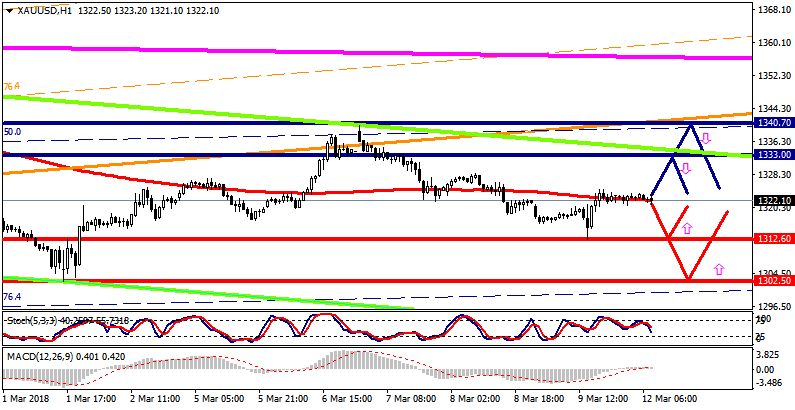
Gold is trading near the zero mark during the Asian session.
- Resistance 1: From $ 1333.00 (Low channel resistance line on H1)
- Resistance 2: From $ 1340.70 (February 26 maximum)
- Support 1: From $ 1312.60 (March 9 minimum)
- Support 2: From $ 1302.50 (March 1 minimum)
Computer analysis: Movings indicators of the Stochastic Oscilliator forex indicator on the H4 chart indicate overbought instruments, on the background of which it is possible gold price reduction.
Silver Chart (current price: $ 16.52)
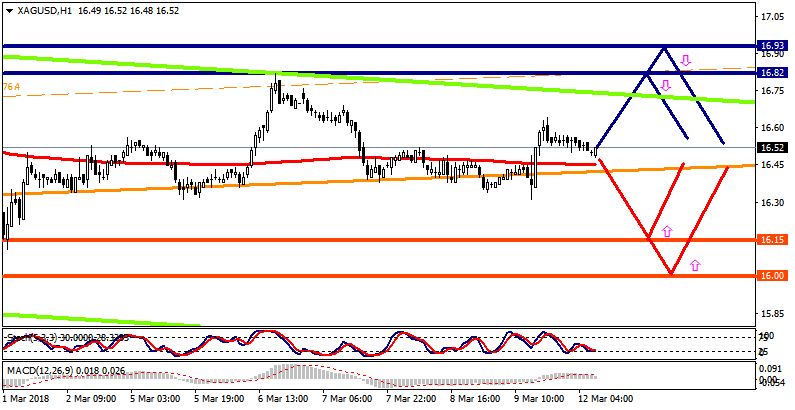
Silver is traded with a small minus during the Asian session.
- Resistance 1: From $ 16.82 (March 6 maximum)
- Resistance 2: From $ 16.93 (February 15 maximum)
- Support 1: From $ 16.15 (technical level)
- Support 2: From $ 16.00 (psychological level)
Computer analysis: Movings indicators of the Stochastic Oscilliator forex indicator on the H4 chart indicate overbought instrument, on the background of which it is possible silver price reduction .