
Oil Technical Analysis (Alexander Sivtsov)
Oil is trading near zero marks during the Asian session.
Brent graph (current price: $ 6413.4 per 100 barrels)
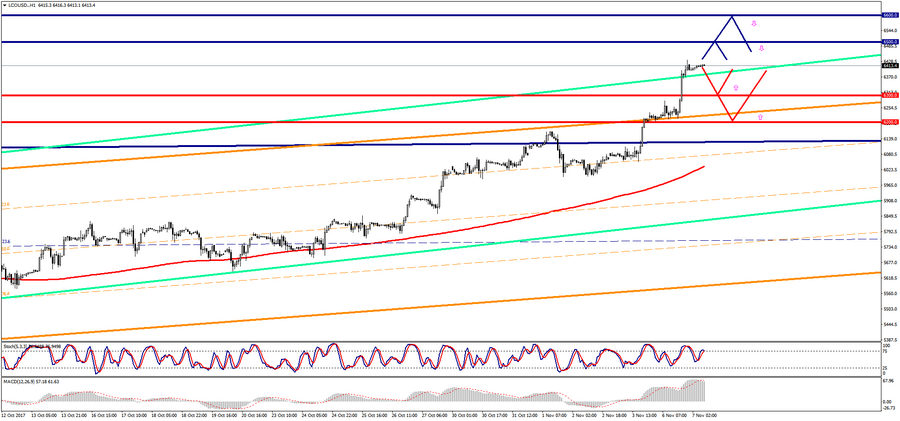
The Brent is trading near the zero mark during the Asian session.
Resistance 1: From $ 6500.00 (psychological level)
Resistance 2: From $ 6600.00 (psychological level)
Support 1: From $ 6300.00 (psychological level)
Support 2: From $ 6200.00 (psychological level)
Computer analysis: The Stochastic Oscillator movings on the chart of H4 and D1 still indicate overbought of the oil. So, one should expect a downward correction of the Brent price in today’s trading.
WTI graph (current price: $ 5741.8 per 100 barrels)
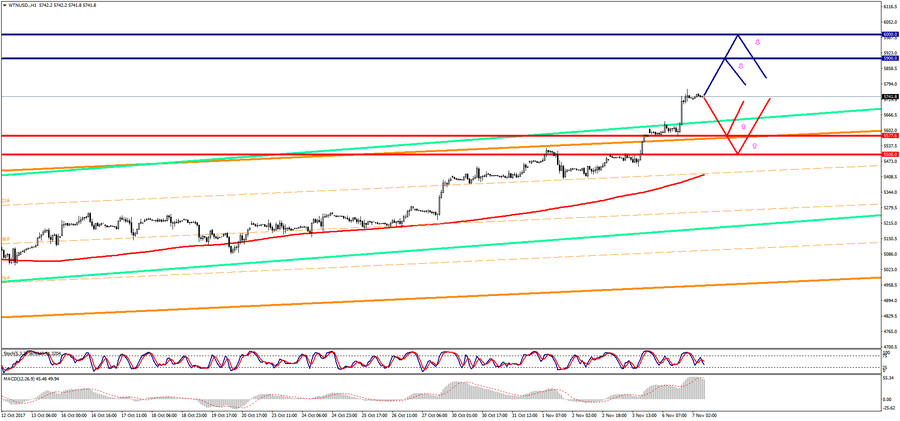
The WTI is trading with a small minus during the Asian session.
Resistance 1: From $ 5900.00 (psychological level)
Resistance 2: From $ 6000.00 (psychological level)
Support 1: From $ 5577.60 (November 6 minimum)
Support 2: From $ 5500.00 (psychological level)
Computer analysis: The Stochastic Oscillator movings on the chart of H4 and D1 indicate the overbought zone. So, one should expect the reduction in the price of the WTI brand.