Ichimoku Kinko Hyo – simple application of a difficult indicator
Ichimoku Kinko Hyo indicator seems difficult for most traders because of its bulkiness in the trading terminal, which can limit its use with other indicators that are superimposed on the price chart.
The Ichimoku Kinko Hyo indicator, despite the first impression, is very simple and can be used as an independent trading system, as well as addition. About its installation and the classic signals to enter the deal you can read here and here.
A bit of background
The Ichimoku Kinko Hyo indicator was developed by Japanese analyst and trader Goichi Hosoda, who has the pseudonym Sanjedin Ishimoku. This indicator began to be used in the stock markets in the 1930s. Later it was modernized and applied on the FOREX market.
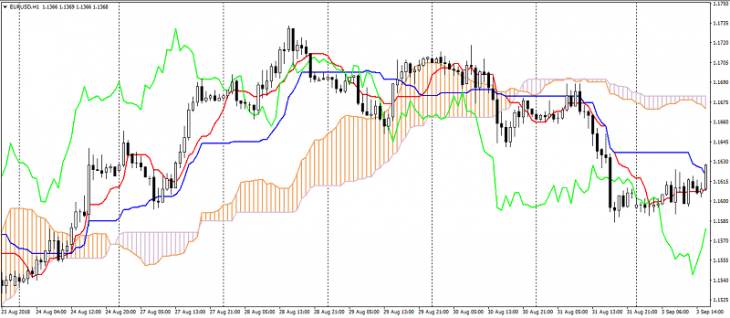
The Ichimoku Kinko Hyo indicator is a trend indicator that combines support and resistance lines. This indicator is actually a display of classic moving averages and MACD indicator. The author himself recommended using this indicator together with candlestick signals and patterns, which increases the effectiveness of trading strategies for the Ichimoku Kinko Hyo indicator and Japanese candlesticks. The indicator is applied on H1 timeframes and higher.
Ichimoku Kinko Hyo Application
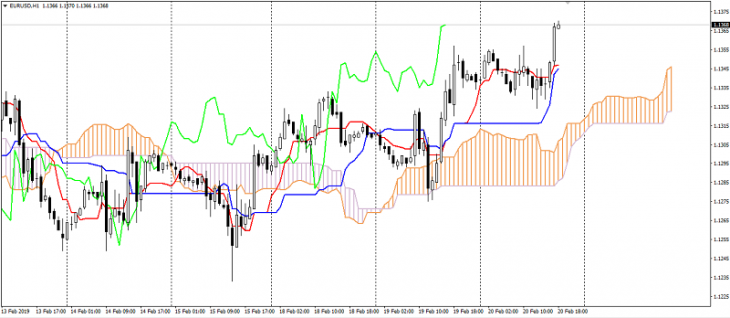
The lines of the Tenkan-sen, Kijun-sen and Chinkou Span indicator are moving averages, giving virtually the same signals as the moving averages (MA). If a faster MA (Tenkan-sen) crosses a slow MA (Kijun-sen) from the bottom to the top it is a signal to buy, from top to bottom it isa signal to sell.
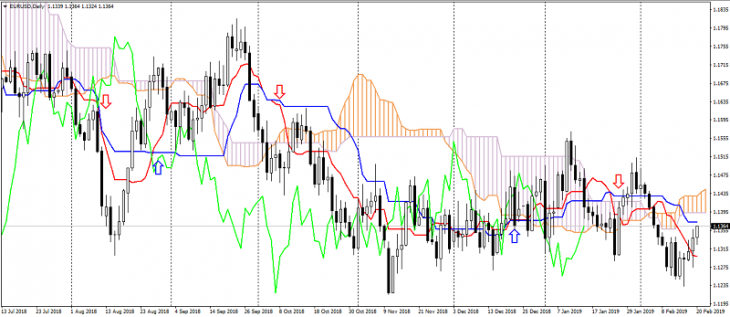
When the lines are crossed again, the deal is closed. Increasing the distance between the Tenkan-sen and Kijun-sen lines indicates the strength of the trend. The greater the distance, the stronger the trend.
The Ichimoku Kinko Hyo indicator cloud (lines Senkou Span A and Senkou Span B) are considered in most cases as strong levels of support and resistance. And the wider the cloud, the more significant are the levels. Most often, traders appreciate the Ichimoku Kinko Hyo indicator for this feature.
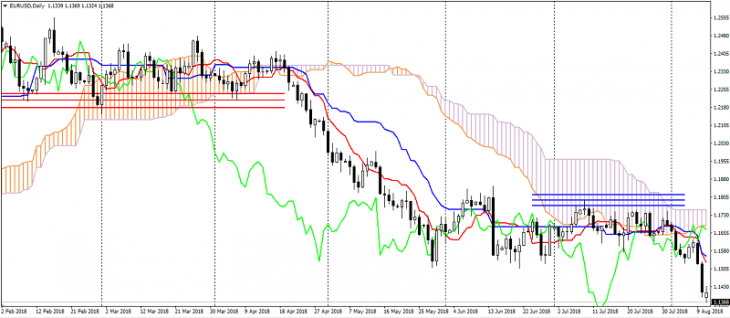
The movement of prices within the cloud indicates the formation of the flat and sometimes the possibility of a trend change.
Disadvantages
The main drawback of the indicator, as well as moving averages, is their lag. It makes classic entry signals very uncomfortable at the current price. At the same time, this indicator is also leading because of its cloud, which is shifted forward, indicating the direction of the trend, its strength and forming support or resistance.
With all its features and drawbacks, the Ichimoku Kinko Hyo indicator is very effective and is used by experienced traders.
Anton Hanzenko