
Technical analys of gold and silver (Anton Hanzenko)
Gold chart (current price: $ 1311.40)
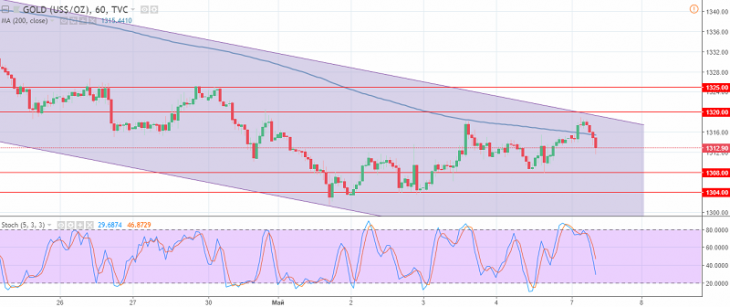
Gold updated a maximum of a month, but it turned out under pressure of correction at the Asian session.
- Resistance 1: From $ 1320.00 (technical level)
- Resistance 2: From $ 1325.65 (April 27 maximum)
- Support 1: From $ 1308.00 (May 4 minimum)
- Support 2: From $ 1304.00 (technical level)
Computer analysis: The Stochastic Oscillator movings shifted to the neutral zone, which may indicate a resumption of the downtrend.
Silver chart (current price: $ 16,460)
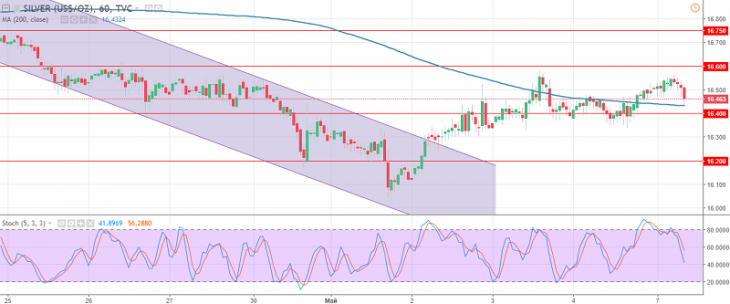
Silver is trading with a slight decline in the Asian session.
- Resistance 1: From $ 16.60 (technical level)
- Resistance 2: From $ 16.75 (April 24 maximum)
- Support 1: From $ 16.40 (technical level)
- Support 2: From $ 16.20 (at least April 4)
Computer analysis: The Stochastic Oscillator movings at the older timeframes are in the overbought zone, which may indicate a slowing of the uptrend and the retention of the flat.