
Technical analysis of gold and silver (Alexander Sivtsov)
Gold chart (current price: $ 1357.70)
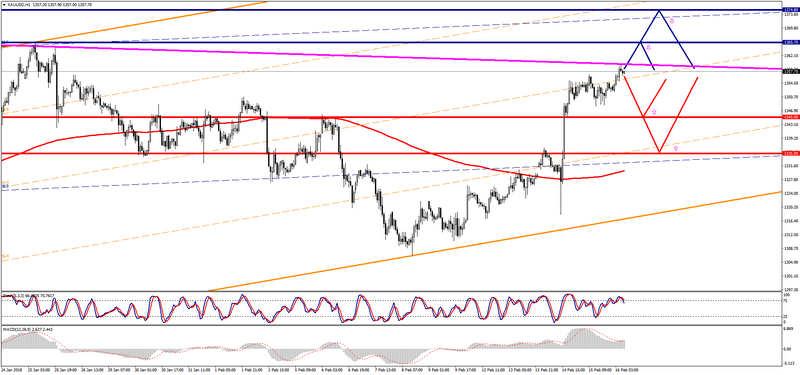
Gold is traded above the zero mark during the Asian session.
- Resistance 1: From $ 1365.70 (January 25 maximum)
- Resistance 2: From $ 1374.80 (2016 maximum)
- Support 1: From $ 1345.00 (technical level)
- Support 2: From $ 1335.00 (technical level)
Computer analysis: The Stochastic Oscillator movings of the forex indicator on the H4 chart indicate overbought of the instrument, there may be some decrease in the price of gold.
Silver chart (current price: $ 16.84)
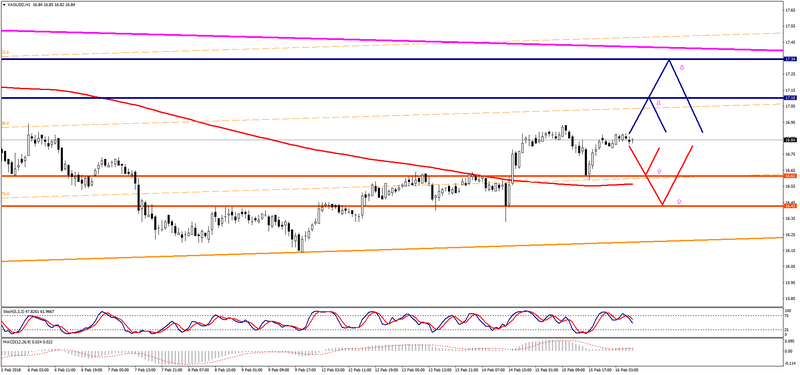
Silver is traded with a plus during the Asian session.
- Resistance 1: From $ 17.10 (technical level)
- Resistance 2: From $ 17.34 (January 31 maximum)
- Support 1: From $ 16.61 (technical level)
- Support 2: From $ 16.43 (technical level)
Computer analysis: The Stochastic Oscillator movings of the forex indicator on the chart H1 are in the neutral zone, against which the formation of the consolidation of the price of silver is possible.