
Technical analysis of gold and silver (Alexander Sivtsov)
Gold chart (current price: $ 1341.60)
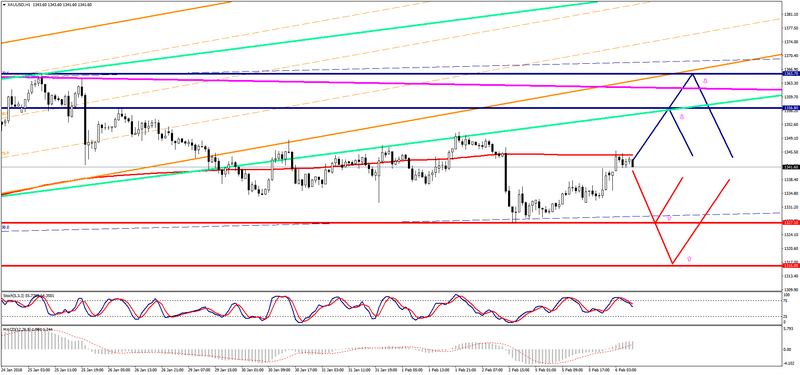
Gold is traded above the zero mark during the Asian session.
- Resistance 1: From $ 1356.80 (January 26 maximum)
- Resistance 2: From $ 1365.70 (January 25 maximum)
- Support 1: From $ 1327.10 (February 5 minimum)
- Support 2: From $ 1316.00 (technical level)
Computer analysis: The Stochastic Oscillator movings on the H1 chart are in the neutral zone. One should expect the continuation of the consolidation of the price of gold during the European session.
Silver chart (current price: $ 16.83)

Silver is traded with a plus during the Asian session.
- Resistance 1: From $ 17.05 (February 1 minimum)
- Resistance 2: From $ 17.35 (February 1 minimum)
- Support 1: From $ 16.51 (January 31 maximum)
- Support 2: From $ 16.28 (technical level)
Computer analysis: The Stochastic Oscillator movings on the H1 chart are in the neutral zone. That is why the price movement of silver in a narrow range is possible.