Technical analysis of gold and silver (Alexander Sivtsov)
Gold chart (current price: $ 1331.70)
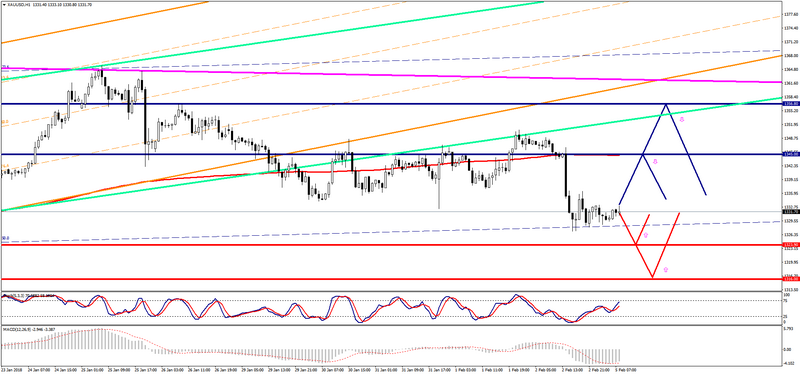
Gold is traded in a narrow range during the Asian session.
- Resistance 1: From $ 1345.00 (MA 200 on H1)
- Resistance 2: From $ 1356.80 (January 26 maximum)
- Support 1: From $ 1323.90 (January 18 minimum)
- Support 2: From $ 1316.00 (technical level)
Computer analysis: The Stochastic Oscillator on the chart of H4 indicate the oversold of the instrument, that is why one should expect a recovery in the price of gold.
Silver chart (current price: $ 16.67)
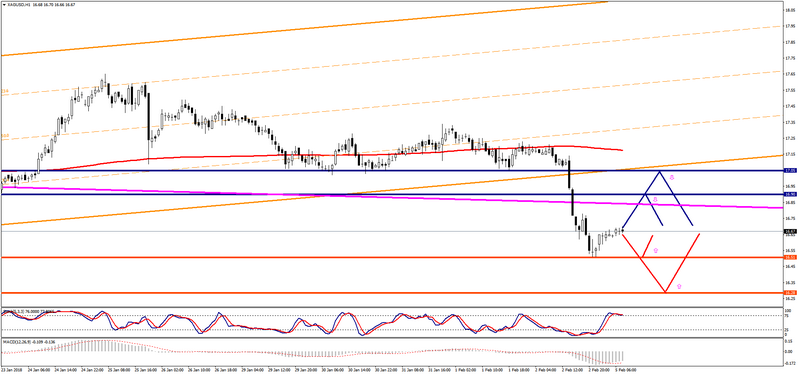
Silver is traded near the zero mark during the Asian session.
- Resistance 1: From $ 16.90 (technical level)
- Resistance 2: From $ 17.05 (February 1 minimum)
- Support 1: From $ 16.51 (February 2 minimum)
- Support 2: From $ 16.28 (technical level)
Computer analysis: The Stochastic Oscillator movings on the H4 chart indicate the oversold of the instrument. That is why the silver price recovery is possible.