
Technical analysis of gold and silver (Alexander Sivtsov)
Gold chart (current price: $ 1339.40)
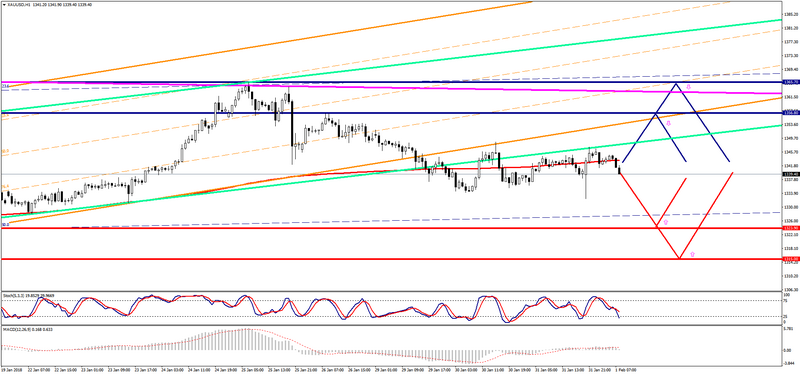
Gold is traded above the zero mark during the Asian session.
- Resistance 1: From $ 1356.80 (January 26 maximum)
- Resistance 2: From $ 1365.70 (January 25 maximum))
- Support 1: From $ 1323.90 (January 18 minimum)
- Support 2: From $ 1315.00 (technical level)
Computer analysis: The Stochastic Oscilliator movings on the chart of H4 indicate overbought of the instrument, ne should expect some reduction in the price of gold.
Silver chart (current price: $ 17.16)
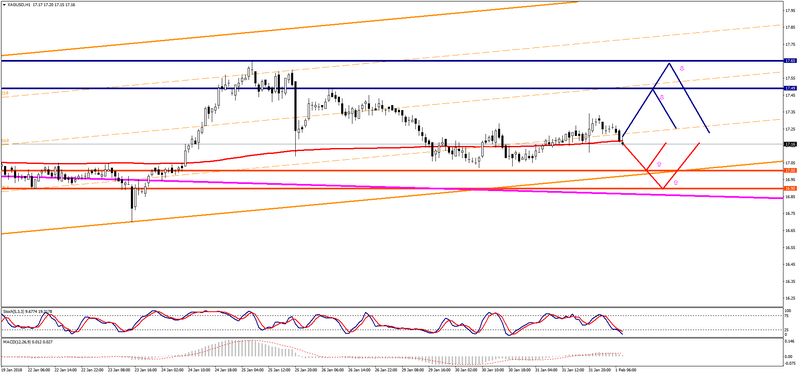
Silver is traded near the zero mark during the Asian session.
- Resistance 1: From $ 17.49 (January 26 maximum)
- Resistance 2: From $ 17.65 (January 25 maximum)
- Support 1: From $ 17.00 (psychological level)
- Support 2: From $ 16.90 (technical level)
Computer analysis: The Stochastic Oscillator movings on the H4 chart indicate overbought of the instrument. There may be some reduction in the price of silver.