
Technical analysis of gold and silver (Alexander Sivtsov)
Gold chart (current price: $ 1360.60)
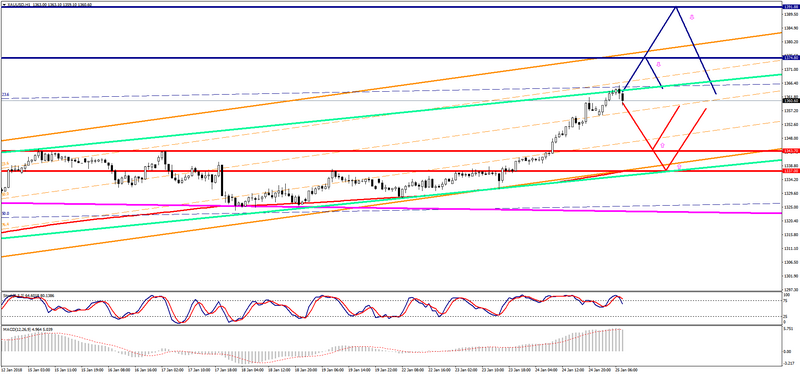
Gold is traded above the zero mark during the Asian session.
- Resistance 1: From $ 1374.80 (2016 maximum)
- Resistance 2: From $ 1391.88 (2014 maximum)
- Support 1: From $ 1343.70 (January 17 maximum)
- Support 2: From $ 1337.00 (MA 200 on H1)
Computer analysis: The Stochastic Oscillator movings on the H4 chart indicate overbought of the instrument, one should expect a downward correction in the price of gold.
Silver chart (current price: $ 17.54)
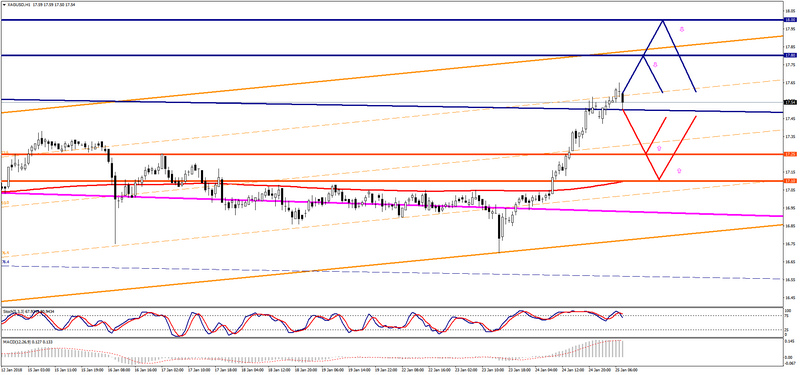
Silver is traded with a plus during the Asian session.
- Resistance 1: From $ 17.80 (technical level)
- Resistance 2: From $ 18.00 (psychological level)
- Support 1: From $ 17.25 (January 17 maximum)
- Support 2: From $ 16.10 (MA 200 on H1)
Computer analysis: The Stochastic Oscillator movings on the H4 chart indicate overbought of the instrumen, which is why a silver price reduction is possible.