
Technical analysis of gold and silver (Alexander Sivtsov)
Gold chart (current price: $ 1333.70)
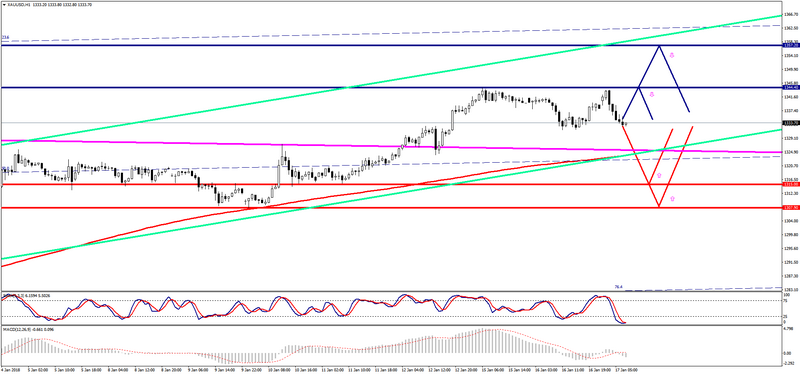
Gold is traded below the zero mark during the Asian session.
- Resistance 1: From $ 1344.40 (January 15 maximum)
- Resistance 2: From $ 1357.20 (September 8 maximum)
- Support 1: From $ 1315.00 (technical level)
- Support 2: From $ 1307.90 (January 10 minimum)
Computer analysis: The Stochastic Oscillator movings on the chart H1 indicate the oversold of the instrument. That is why one should expect a recovery in the price of gold.
Silver chart (current price: $ 17.09)
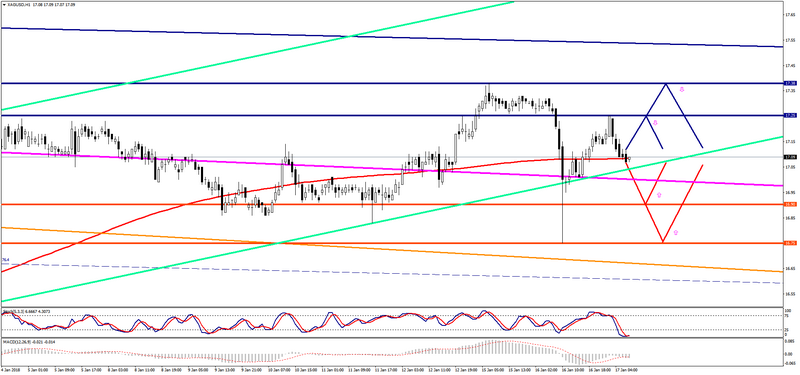
Silver is traded with a minus during the Asian session.
- Resistance 1: From $ 17.25 (January 17 maximum)
- Resistance 2: From $ 17.38 (January 15 maximum)
- Support 1: From $ 16.90 (technical level)
- Support 2: From $ 16.75 (January 16 minimum)
Computer analysis: The Stochastic Oscillator movings on the H1 chart indicate the oversold of the instrument, so the situation may be similar to gold.