
Technical analysis of gold and silver (Alexander Sivtsov)
Gold chart (current price: $ 1275.00)
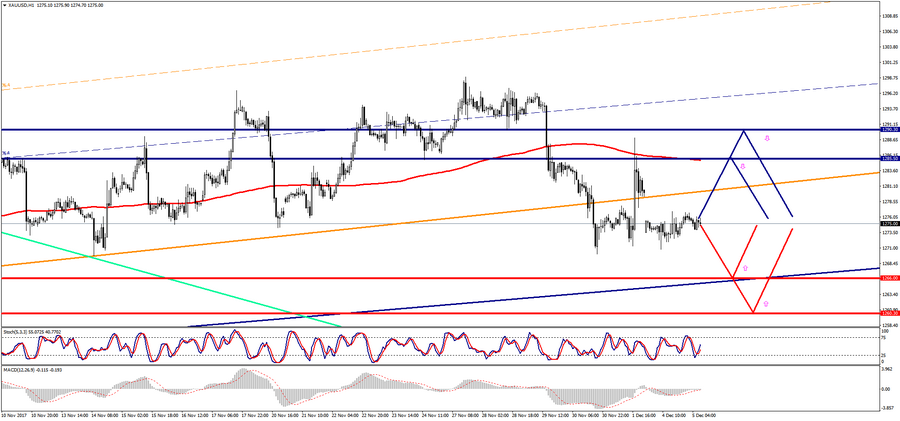
Gold is trading near the zero mark during the Asian session.
- Resistance 1: From $ 1285.50 (MA 200 on H1)
- Resistance 2: From $ 1290.30 (November 28 minimum)
- Support 1: From $ 1266.00 (Up Channel line on D1)
- Support 2: From $ 1260.30 (October 6 minimum)
Computer analysis: The Stochastic Oscillator movings on the charts H1 and H4 are in the neutral zone, so the consolidation process of the gold price is continuing.
Silver chart (current price: $ 16.27)
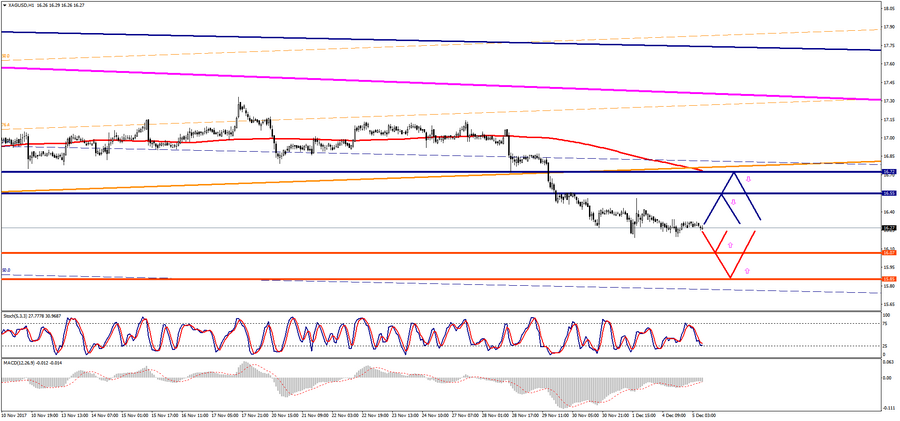
Silver is trading just below the zero mark during the Asian session.
- Resistance 1: From $ 16.55 (technical level)
- Resistance 2: From $ 16.72 (November 28 minimum)
- Support 1: From $ 16.07 (August 7 minimum)
- Support 2: From $ 15.85 (technical level)
Computer analysis: The Stochastic Oscillator movings on the charts of H1 and D1 indicate the oversold of the instrument,the recovery of the silver price is possible.