
Тechnical analysis of currency pairs (Anton Hanzenko)
EUR USD (current price: 1.2390)
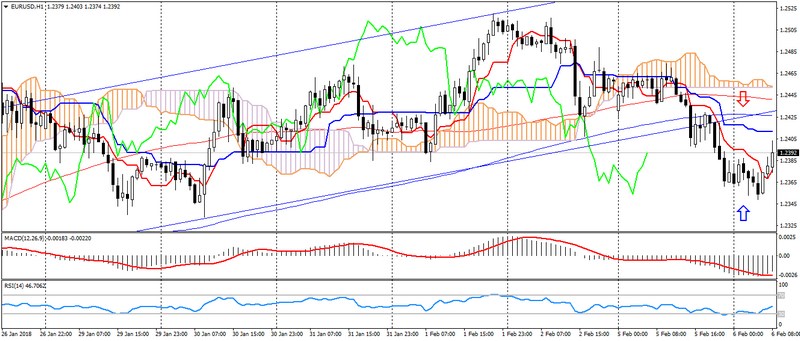
- Support levels: 1.2100 (September 2017 maximum), 1.1900, 1.1700.
- Resistance levels: 1.2600, 1.2750 (March 2013 minimum), 1.2270 (November 2014 minimum).
- Computer analysis: MACD (12, 26, 9) (signal – upward movement): the indicator is below 0, the signal line has left the body of the histogram. RSI (14) is in the neutral zone. Ichimoku Kinko Hyo (9, 26, 52) (signal – downward movement): the Tenkan-sen line is below the Kijun-sen line, the price is below the cloud.
- The main recommendation: sale entry is started from 1.2410, 1.2440, 1.2470.
- Alternative recommendation: buy entry is started from 1.2350, 1.2320, 1.2270.
The euro dollar pair accelerated the decline on the general flight from risks caused by the decline in stock indices. As a result, the pair has renewed a minimum of a week, but remains under pressure due to the persistence of negative sentiments.
GBP USD (current price: 1.3960)

- Support levels: 1.4000 (April 2016 minimum), 1.3820, 1.3650 (September 2017 maximum).
- Resistance levels: 1.43500, 1.4500, 1.4750 (May May 2016 maximum).
- Computer analysis: MACD (12, 26, 9) (signal – upward movement): the indicator is below 0, the signal line has left the body of the histogram. RSI (14) is in the neutral zone. Ichimoku Kinko Hyo (9, 26, 52) (signal – downward movement): the Tenkan-sen line is below the Kijun-sen line, the price is below the cloud.
- The main recommendation: sale entry is started from 1.4000, 1.4040, 1.4090.
- Alternative recommendation: buy entry is started from 1.3940, 1.3900, 1.3850.
The British pound retains the potential to decline fixing below the level of 1.4000, which may indicate a further decrease in the pound on the development of the “double top” figure.
USD CHF (current price: 0.9330)
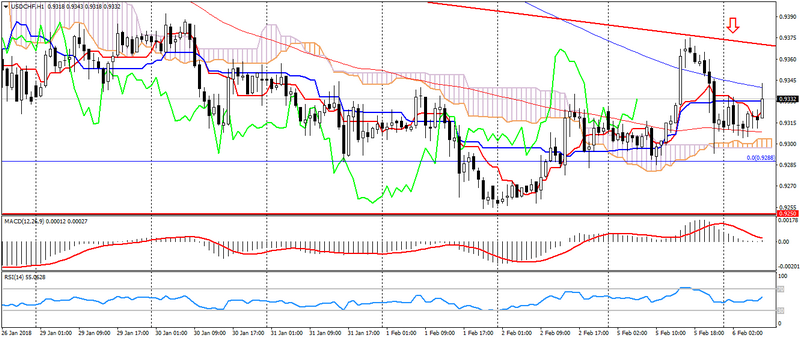
- Support levels: 0.9250 (August 2015 minimum), 0.9150, 0.9050 (May 2015 minimum).
- Resistance levels:, 0.9550, 0.9800, 1.0030 (November 2017 maximum).
- Computer analysis: MACD (12, 26, 9) (signal – downward movement): the indicator is above 0, the signal line has left the body of the histogram. RSI (14) is in the neutral zone. Ichimoku Kinko Hyo (9, 26, 52) (signal – upward movement, flat): the Tenkan-sen line is below the Kijun-sen line, the price is higher than the cloud.
- The main recommendation: sale entry is started from 0.9350, 0.9370, 0.9390.
- Alternative recommendation: buy entry is started from 0.9320, 0.9280, 0.9260.
The Swiss franc strengthened earlier in the day based on flights from risks, but is still traded in a sideways trend, indicating a slowdown in the upward trend.
USD JPY (current price: 109.00)
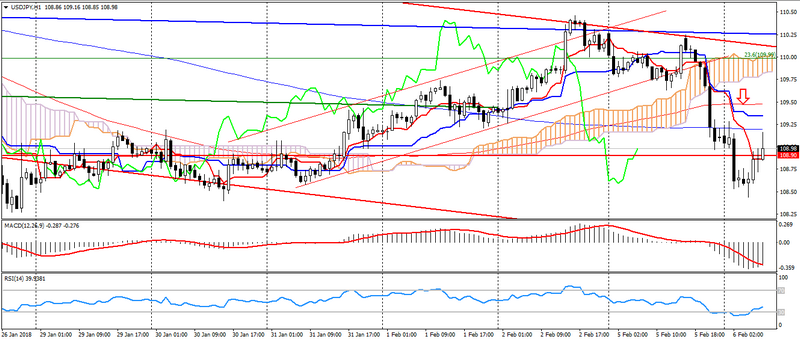
- Support levels: 108.90, 108.10 (April 2017 minimum), 107.30 (2017 minimum).
- Resistance levels: 110.80, 111.70 (October 2017 minimum), 113.70.
- Computer analysis: MACD (12, 26, 9) (signal – downward movement): the indicator is below 0, the signal line is in the body of the histogram. RSI (14) is in the neutral zone. Ichimoku Kinko Hyo (9, 26, 52) (signal – downward movement): the Tenkan-sen line is below the Kijun-sen line, the price is below the cloud.
- The main recommendation: sale entry is started from 109.30, 109.50, 109.80.
- Alternative recommendation: buy entry is started from 108.90, 108.50, 108.20.
The Japanese yen accelerated growth on the flight from risks. In this case, the pair maintains a downtrend, limited to a support level of 108.90.
USD CAD (current price: 1.2540)

- Support levels: 1.2340, 1.2200, 1.2060 (2017 minimum).
- Resistance levels: 1.2500, 1.2650, 1.2770 (August 2017 maximum).
- Computer analysis: MACD (12, 26, 9) (signal – downward movement): the indicator is higher than 0, the signal line has left the body of the histogram. RSI (14) is in the overbought zone. Ichimoku Kinko Hyo (9, 26, 52) (signal – upward movement): the Tenkan-sen line is above the Kijun-sen line, the price is higher than the cloud.
- The main recommendation: sale entry is started from 1.2560, 1.2590, 1.2620.
- Alternative recommendation: buy entry is started from 1.2500, 1.2480, 1.2450.
The Canadian dollar broke the uptrend on the negative dynamics of raw materials and flight from risks, which indicates the possibility of further decline after a slight correction.
AUD USD (current price: 0.7860)
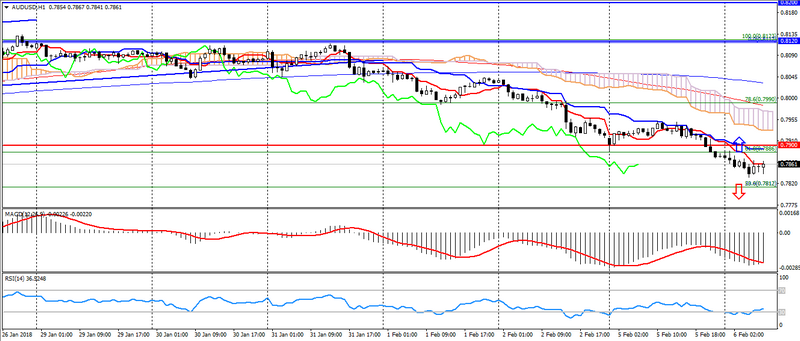
- Support levels: 0.7900, 0.7700 (March 2017 maximum), 0.7500.
- Resistance levels: 0.8120 (2017 maximum), 0.8200, 0.8290 (2014 maximum).
- Computer analysis: MACD (12, 26, 9) (signal – downward movement): the indicator is below 0, the signal line is in the body of the histogram. RSI (14) is in the neutral zone. Ichimoku Kinko Hyo (9, 26, 52) (signal – downward movement): the Tenkan-sen line is below the Kijun-sen line, the price is below the cloud.
- The main recommendation: sale entry is started from 0.7900, 0.7940, 0.7970.
- Alternative recommendation: buy entry is started from 0.7830, 0.7800, 0.7780.
The Australian is under pressure of weak data on Australia and flight from risks. Further decline in the pair may be limited by bullish divergence and oversold.
NZD USD (current price: 0.7300)
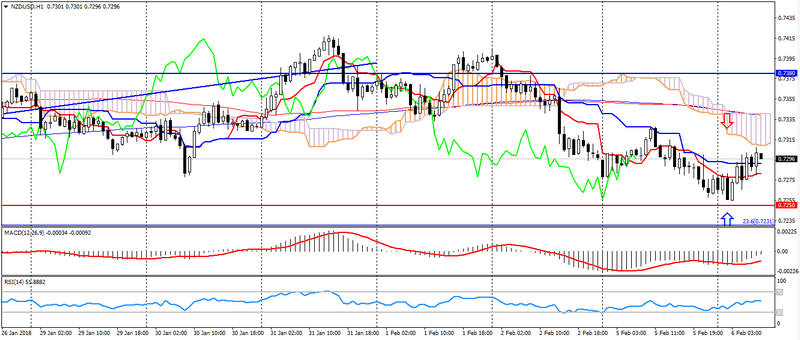
- Support levels: 0.7250, 0.7130 (August 2017 minimum), 0.7000.
- Resistance levels: 0.7380, 0.7450, 0.7550 (2017 maximum).
- Computer analysis: MACD (12, 26, 9) (signal – upward movement): the indicator is below 0, the signal line has left the body of the histogram. RSI (14) is in the neutral zone. Ichimoku Kinko Hyo (9, 26, 52) (signal – downward movement): the Tenkan-sen line is below the Kijun-sen line, the price is below the cloud.
- The main recommendation: sale entry is started from 0.7330, 0.7350, 0.7380.
- Alternative recommendation: buy entry is started from 0.7250, 0.7230, 0.7200.
The New Zealand dollar is traded in a sideways trend near supports at 0.7250, while reacting quite steadily to flight risks and the sales off of commodity assets.
XAU USD (current price: 1342.00)
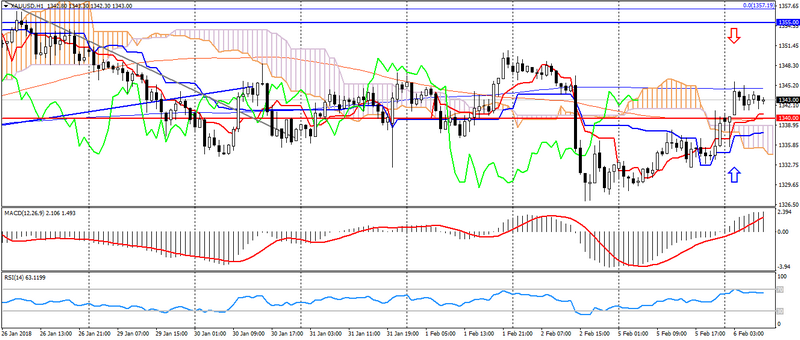
- Support levels: 1340.00, 1320.00, 1303.00.
- Resistance levels: 1355.00 (May May 2016 maximum), 1374.00, 1290.00 (March 2016 maximum).
- Computer analysis: MACD (12, 26, 9) (signal – upward movement): the indicator is above 0, the signal line is in the body of the histogram. RSI (14) is in the neutral zone. Ichimoku Kinko Hyo (9, 26, 52) (signal – upward movement): the Tenkan-sen line is above the Kijun-sen line, the price is higher than the cloud.
- The main recommendation: sale entry is started from 1347.00, 1350.00, 1355.00.
- Alternative recommendation: buy entry is started from 1340.00, 1335.00, 1332.00.
Gold maintains a positive momentum on the flight of investors from risks, but so far limited to last week’s highs. As a result, a slight slowdown in the price of gold is possible.