
Тechnical analysis of currency pairs (Anton Hanzenko)
EUR USD (current price: 1.2450)
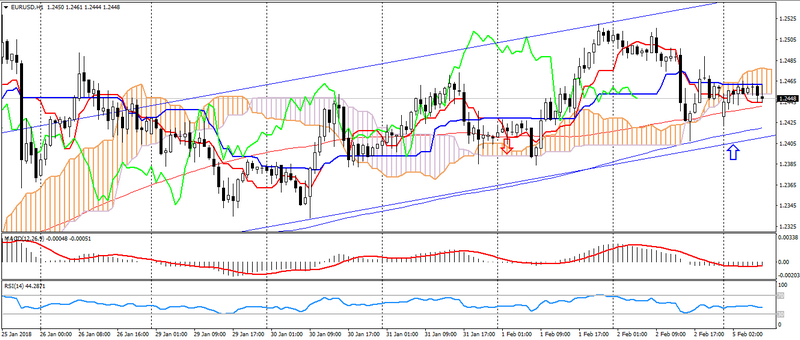
- Support levels: 1.2100 (September 2017 maximum), 1.1900, 1.1700.
- Resistance levels: 1.2600, 1.2750 (March 2013 minimum), 1.2270 (November 2014 minimum).
- Computer analysis: MACD (12,26,9) (signal- downward movement): the indicator is below 0, the signal line is in the body of the histogram. RSI (14) is in the neutral zone. IchimokuKinkoHyo (9,26,52) (signal – flat): the Tenkan-sen line is below the Kijun-sen line, the price is in the cloud.
- The main recommendation: sale entry is started from 1.2470, 1.2500, 1.2520.
- Alternative recommendation: buy entry is started from 1.2430, 1.2400, 1.2380.
The euro remains at the level of the opening day after the strengthening of the American based on Friday data on employment across the spectrum of the market. Despite significant support of the positive data, this pair failed to reverse the uptrend. At the same time, there is some optimism towards the American, but the pair is limited to an upward trend.
GBP USD (current price: 1.4090)
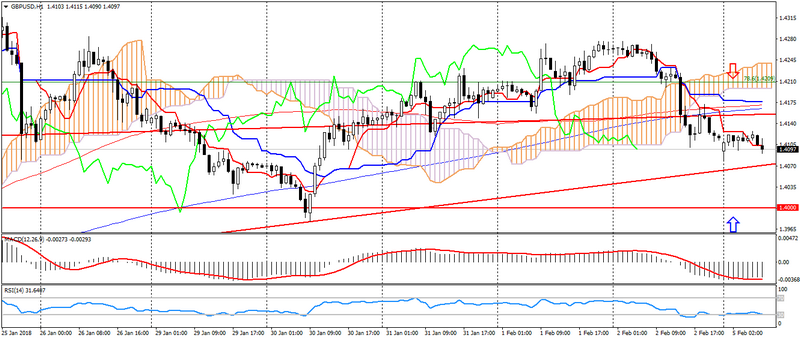
- Support levels: 1.4000 (April 2016 minimum), 1.3820, 1.3650 (September 2017 maximum).
- Resistance levels: 1.43500, 1.4500, 1.4750 (May May 2016 maximum).
- Computer analysis: MACD (12,26,9) (signal – downward movement): the indicator is below 0, the signal line is in the body of the histogram. RSI (14) is in the oversold zone. IchimokuKinkoHyo (9,26,52) (signal – downward movement): the Tenkan-sen line is below the line Kijun-sen, the price is below the cloud.
- The main recommendation: sale entry is started from 1.4140, 1.4180, 1.4210.
- Alternative recommendation: buy entry is started from 1.4070, 1.4030, 1.4000.
The British pound is weak at the beginning of the week because of the repulsion from significant resistance levels, forming a “double top”. Also, the pair is limited to an uptrend and support levels of 1.4070 and 1.4000.
USD CHF (current price: 0.9310)
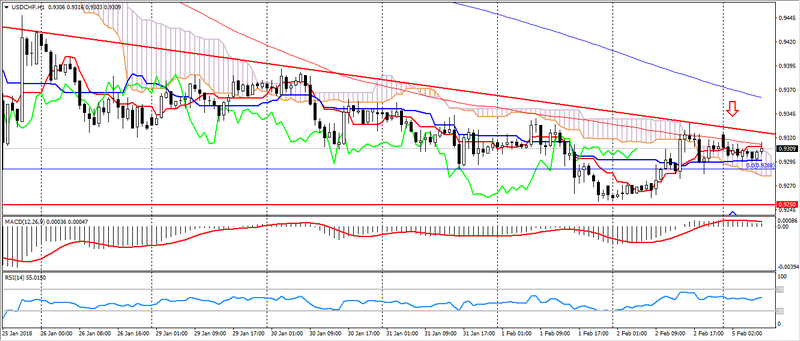
- Support levels: 0.9250 (August 2015 minimum), 0.9150, 0.9050 (May 2015 minimum).
- Resistance levels:, 0.9550, 0.9800, 1.0030 (November 2017 maximum).
- Computer analysis: MACD (12,26,9) (signal – upward movement): the indicator is above 0, the signal line is in the body of the histogram. RSI (14) is in the neutral zone. IchimokuKinkoHyo (9,26,52) (signal – upward movement): the Tenkan-sen line is above the Kijun-sen line, the price is higher than the cloud.
- The main recommendation: sale entry is started from 0.9330, 0.9350, 0.9370.
- Alternative recommendation: buy entry is started from 0.9290, 0.9260, 0.9240.
The Swiss franc also accelerated growth on the weakness of the American. As a result, the pair renewed the three-year minimum. At the same time, 0.9250 support remains in force, despite the safety of the downward trend and the expectation of upcoming data on employment in the US.
USD JPY (current price: 109.90)
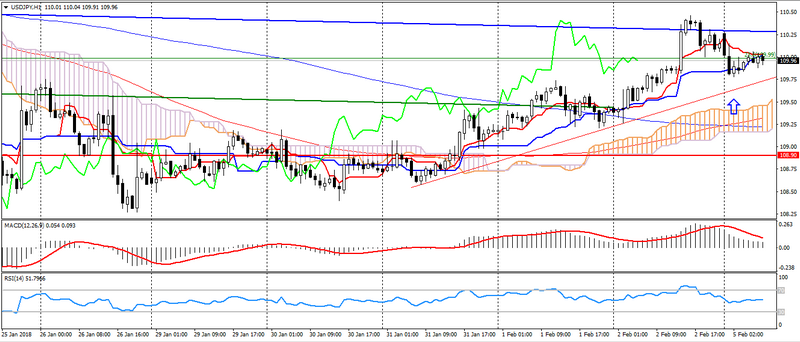
- Support levels: 108.90, 108.10 (April 2017 minimum), 107.30 (2017 minimum).
- Resistance levels: 110.80, 111.70 (October 2017 minimum), 113.70.
- Computer analysis: MACD (12, 26, 9) (signal – downward movement): the indicator is above 0, the signal line has left the histogram bar. RSI (14) is in the neutral zone. IchimokuKinkoHyo (9,26,52) (signal- downward movement): the Tenkan-sen line is above the Kijun-sen line, the price is higher than the cloud.
- The main recommendation: sale entry is started from 110.20, 110.50, 110.80.
- Alternative recommendation: buy entry is started from 109.70, 109.50, 109.20.
The Japanese yen remains under pressure from the policy of the Bank of Japan, which maintains soft rhetoric. In this case, the pair is limited to a resistance level of 110.50, which limits the growth of the pair
USD CAD (current price: 1.2420)
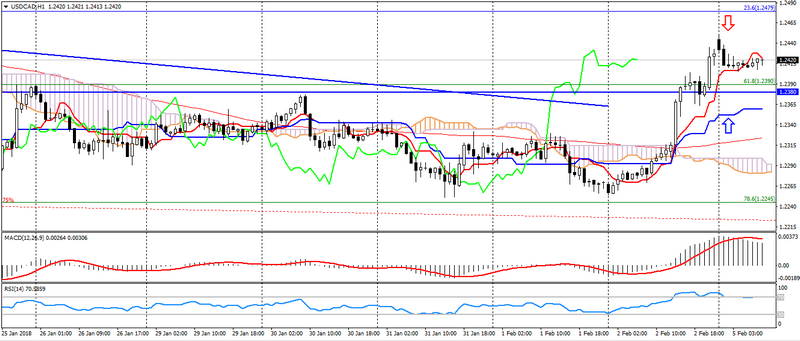
- Support levels: 1.2200, 1.2060 (2017 minimum), 1.1950 ( 2015 minimum).
- Resistance levels: 1.2380, 1.2500, 1.2650.
- Computer analysis: MACD (12, 26, 9) (signal – downward movement): the indicator is above 0, the signal line has left the body of the histogram. RSI (14) is in the overbought zone. IchimokuKinkoHyo (9,26,52) (signal – upward movement): the Tenkan-sen line is above the Kijun-sen line, the price is higher than the cloud.
- The main recommendation: sale entry is started from 1.2450, 1.2470, 1.2500.
- Alternative recommendation: buy entry is started from 1.2400, 1.2380, 1.2350.
The Canadian dollar emerged from an uptrend, while it is limited to strong levels of resistance and overbought of the American. This may resume a downtrend of the pair.
AUD USD (current price: 0.7920)
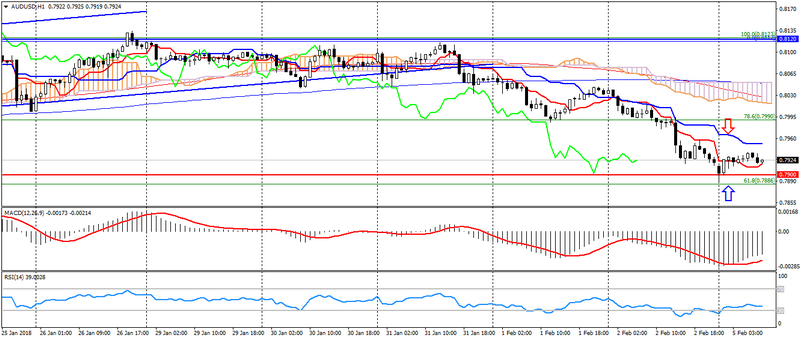
- Support levels: 0.7900, 0.7700 (March 2017 maximum), 0.7500.
- Resistance levels: 0.8120 (2017 maximum), 0.8200, 0.8290 (2014 maximum).
- Computer analysis: MACD (12, 26, 9) (signal – upward movement): the indicator is below 0, the signal line has left the body of the histogram. RSI (14) is in the neutral zone. IchimokuKinkoHyo (9,26,52) (signal – downward movement): the Tenkan-sen line is below the Kijun-sen line, the price is below the cloud.
- The main recommendation: sale entry is started from 0.7950, 0.7980, 0.8020.
- Alternative recommendation: buy entry is started from 0.7900, 0.7880, 0.7850.
The Australian is under pressure of correction, limited to psychology 0.7900.
NZD USD (current price: 0.7300)

- Support levels: 0.7250, 0.7130 (August 2017 minimum), 0.7000.
- Resistance levels: 0.7380, 0.7450, 0.7550 (2017 maximum).
- Computer analysis: MACD (12, 26, 9) (signal-upward movement): the indicator is below 0, the signal line has left the body of the histogram. RSI (14) is in the neutral zone. IchimokuKinkoHyo (9,26,52) (signal – downward movement): the Tenkan-sen line is below the Kijun-sen line, the price is below the cloud.
- The main recommendation: sale entry is started from 0.7320, 0.7350, 0.7380.
- Alternative recommendation: buy entry is started from 0.7280, 0.7250, 0.7230.
The New Zealand dollar is traded in a sideways trend near supports 0.7250 and 0.7230.
XAU USD (current price: 1334.00)
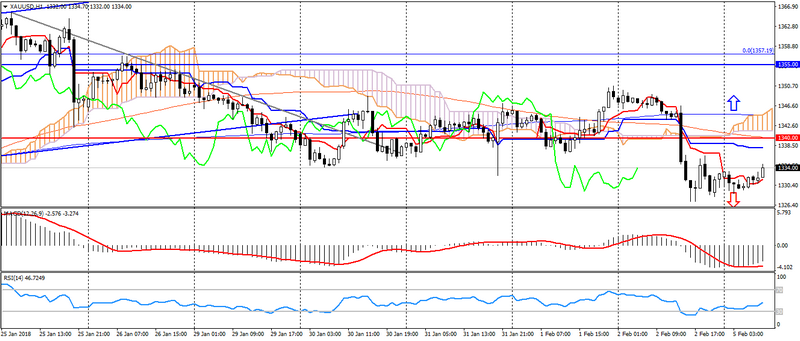
- Support levels: 1340.00, 1320.00, 1303.00.
- Resistance levels: 1355.00 (May May 2016 maximum), 1374.00, 1290.00 (March 2016 maximum).
- Computer analysis: MACD (12, 26, 9) (signal – upward movement): the indicator is below 0, the signal line has left the histogram bar. RSI (14) is in the neutral zone. IchimokuKinkoHyo (9,26,52) (signal- upward movement): the Tenkan-sen line is below the Kijun-sen line, the price is below the cloud.
- The main recommendation: sale entry is started from 1338.00, 1340.00, 1346.00.
- Alternative recommendation: buy entry is started from 1328.00, 1325.00, 1322.00.
Gold also slowed the upward dynamics, remaining in the sideways trend, which in the end may indicate the formation of correction.