
Технічний аналіз валютних пар (Антон Ганзенко)
EUR USD (поточна ціна: 1.1750)
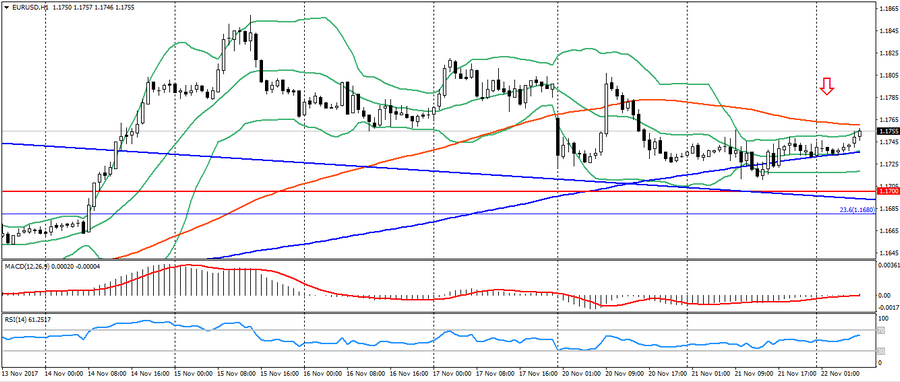
- Рівні підтримки: 1.1700 (максимум серпня 2015 року), 1.1600 (максимум 2016 року), 1.1470.
- Рівні опору: 1.2000, 1.2100, 1.2270 (мінімум листопада 2014 року).
- Комп’ютерний аналіз: MACD (сигнал – висхідний рух): індикатор вище 0, сигнальна лінія в тілі гістограми. RSI в нейтральній зоні. Bollinger Bands (період 20): нейтрально, зростаюча волатильність.
- Основна рекомендація: вхід на продаж від 1.1770 (MA 100), 1.1810, 1.1830.
- Альтернативна рекомендація: вхід на покупку від 1.1720, 1.1680 (Фібо. 23.6 від мінімуму грудня 2016 року), 1.1650.
Євро продовжує зміцнюватися на початку дня, зберігаючи позитивний настрій на корекції позицій по американцеві, разом з цим, спадний тренд по даній парі також зберігається.
GBP USD (поточна ціна: 1.3250)
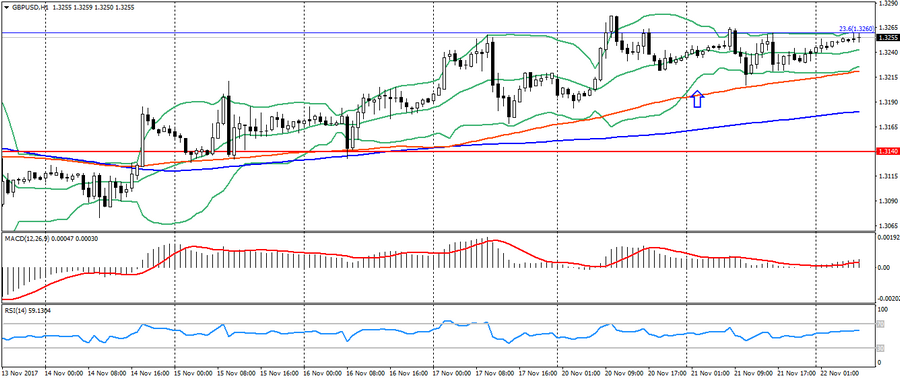
- Рівні підтримки: 1.3140, 1.2900, 1.2740 (мінімум серпня 2017 року).
- Рівні опору: 1.3500, 1.3660, 1.3830 (мінімум лютого 2016 року).
- Комп’ютерний аналіз: MACD (сигнал – висхідний рух): індикатор вище 0, сигнальна лінія в тілі гістограмми.RSI в нейтральній зоні. Bollinger Bands (період 20): нейтрально, низька волатильність.
- Основна рекомендація: вхід на продаж від 1.3270, 1.3300, 1.3340.
- Альтернативна рекомендація: вхід на покупку від 1.3220 (MA 100), 1.3180 (MA 200), 1.3140.
Британський фунт також продовжує зберігати висхідний тренд, отримуючи підтримку від слабкості американця. Але, дана пара як і раніше обмежується двомісячним бічним трендом.
USD CHF (поточна ціна: 0.9890)
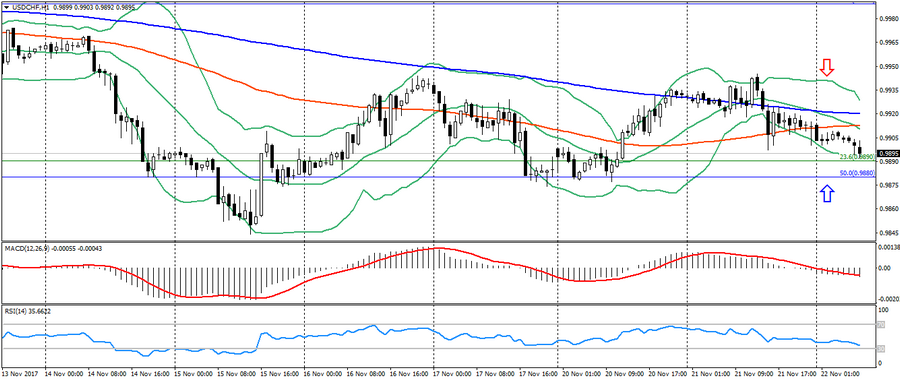
- Рівні підтримки: 0.9700, 0.9600, 0.9530.
- Рівні опору : 1.0000, 1.0050, 1.0100 (максимум травня).
- Комп’ютерний аналіз: MACD (сигнал – спадний рух): індикатор нижче 0, сигнальна лінія в тілі гістограми. RSI в зоні перепроданості. Bollinger Bands (період 20): нейтрально, знижується волатильність.
- Основна рекомендація: вхід на продаж від 0.9920 (MA 200), 0.9940, 0.9970.
- Альтернативна рекомендація: вхід на покупку від 0.9880 (Фібо. 50.0 від максимуму листопада 2016 року), 0.9860, 0.9840.
Швейцарський франк залишається торгуватися біля значущої підтримки, в якій можливе уповільнення зростання франка.
USD JPY (поточна ціна: 112.10)
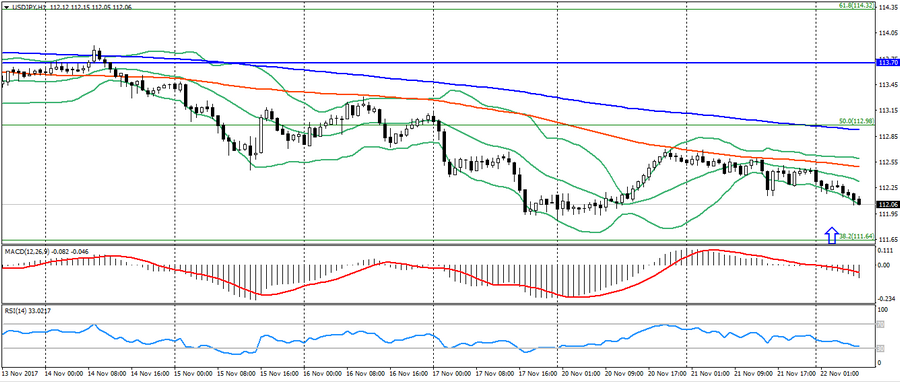
- Рівні підтримки: 108.90, 108.10 (мінімум квітня 2017 року), 107.30 (мінімум 2017 року).
- Рівні опору: 113.70, 114.50 (максимум липня 2017 року), 115.00.
- Комп’ютерний аналіз: MACD (сигнал – спадний рух): індикатор нижче 0, сигнальна лінія в тілі гістограми. RSI в зоні перепроданості. Bollinger Bands (період 20): перепроданність, зростаюча волатильність.
- Основна рекомендація: вхід на продаж від 112.50 (MA 100), 112.90 (Фібо. 50.0 від максимуму грудня), 113.30.
- Альтернативна рекомендація: вхід на покупку від 111.90, 111.60 (Фібо. 38.2 від максимуму грудня), 111.30.
Японська єна продовжує торгуватися зі зміцненням, зберігаючи спадний тренд по парі, але подальше зниження буде обмежуватися зонною 111.60.
USD CAD (поточна ціна: 1.2760)
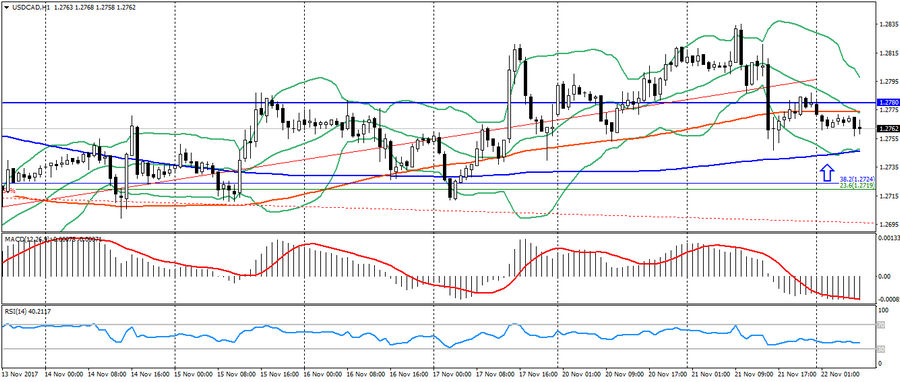
- Рівні підтримки: 1.2200, 1.2060 (мінімум 2017 року), 1.1950 (мінімум 2015 року).
- Рівні опору: 1.2780 (максимум серпня 2017), 1.3000, 1.3160.
- Комп’ютерний аналіз: MACD (сигнал – спадний рух): індикатор нижче 0, сигнальна лінія в тілі гістограми. RSI в нейтральній зоні. Bollinger Bands (період 20): нейтрально, знижується волатильність.
- Основна рекомендація: вхід на продаж від 1.2780, 1.2800, 1.2830.
- Альтернативна рекомендація: вхід на покупку від 1.2740 (MA 200), 1.2720 (Фібо. 23.6 мінімуму вересня), 1.2700.
Канадський долар демонструє невелике зростання на зростанні цін на сировину, разом з цим, загальна динаміка пари продовжує залишатися висхідною.
AUD USD (поточна ціна: 0.7570)
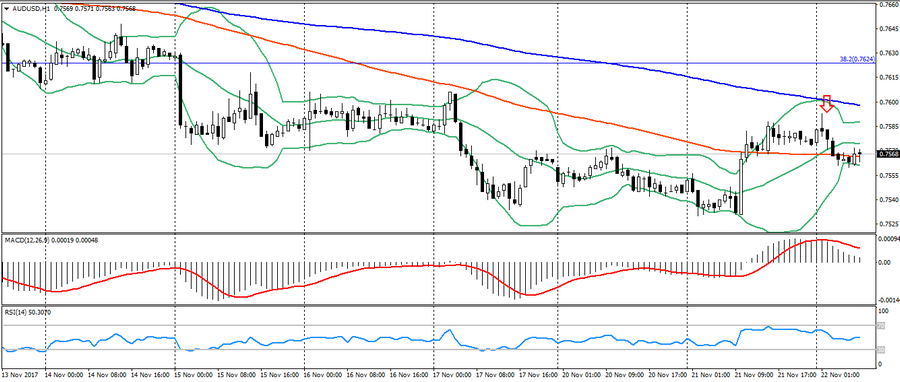
- Рівні підтримки: 0.7740, 0.7320 (мінімум 2017 року), 0.7120.
- Рівні опору: 0.8120 (максимум 2017 року), 0.8200, 0.8290 (максимум 2014 року).
- Комп’ютерний аналіз: MACD (сигнал – спадний рух): індикатор вище 0, сигнальна лінія вийшла з тіла гістограми. RSI в нейтральній зоні. Bollinger Bands (період 20): нейтрально, низька волатильність.
- Основна рекомендація: вхід на продаж від 0.7580, 0.7600 (MA 200), 0.7630.
- Альтернативна рекомендація: вхід на покупку від 0.7550, 0.7530, 0.7500.
Австралієць також зміцнився на зростанні цін на сировину, але на початку дня потрапив під корекцію, що зумовлено загальним спадним трендом.
NZD USD (поточна ціна: 0.6830)
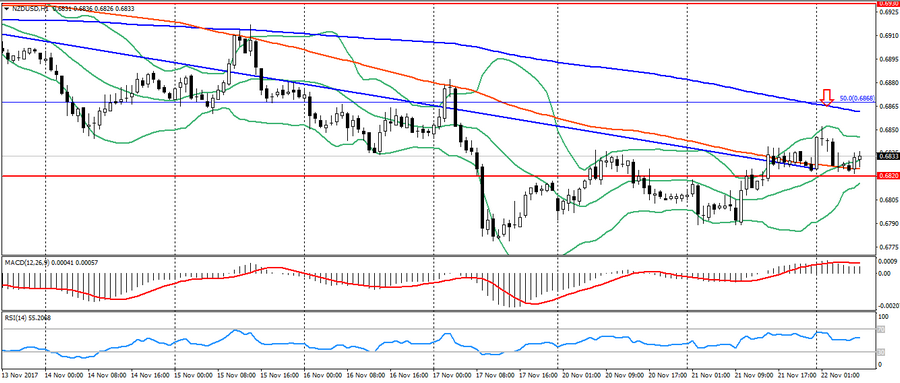
- Рівні підтримки: 0.7000, 0.6930, 0.6820 (мінімум поточного року).
- Рівні опору: 0.7380, 0.7450, 0.7550 (максимум 2017 року).
- Комп’ютерний аналіз: MACD (сигнал – спадний рух): індикатор вище 0, сигнальна лінія вийшла з тіла гістограми. RSI в нейтральній зоні. Bollinger Bands (період 20): нейтрально, низька волатильність.
- Основна рекомендація: вхід на продаж від 0.6840, 0.6860 (MA 200), 0.6880.
- Альтернативна рекомендація: вхід на покупку від 0.6820, 0.6800, 0.6780 (мінімум листопада).
Новозеландський долар демонструє уповільнення спадного тренда, підтверджуючи формування корекції.
XAU USD (поточна ціна: 1283.00)
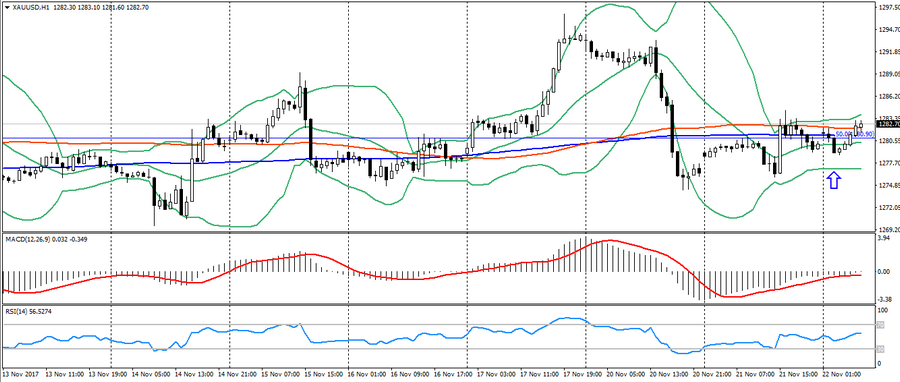
- Рівні підтримки: 1250.00, 1226.00, 1200.00.
- Рівні опору: 1340.00, 1355.00, 1374.00 (максимум 2016 року).
- Комп’ютерний аналіз: MACD (сигнал – висхідний рух): індикатор нижче 0, сигнальна лінія вийшла з тіла гістограми. RSI в нейтральній зоні. Bollinger Bands (період 20): нейтрально, зростаюча волатильність.
- Основна рекомендація: вхід на продаж від 1284.00, 1289.00, 1296.00.
- Альтернативна рекомендація: вхід на покупку від 1278.00, 1273.00, 1270.00.
Золото трохи зміцнилося на початку дня на зростанні ризиків, тим самим зберігши загальний висхідний тренд.