
Тechnical analysis of currency pairs (Anton Hanzenko)
EUR USD (current price: 1.1810)
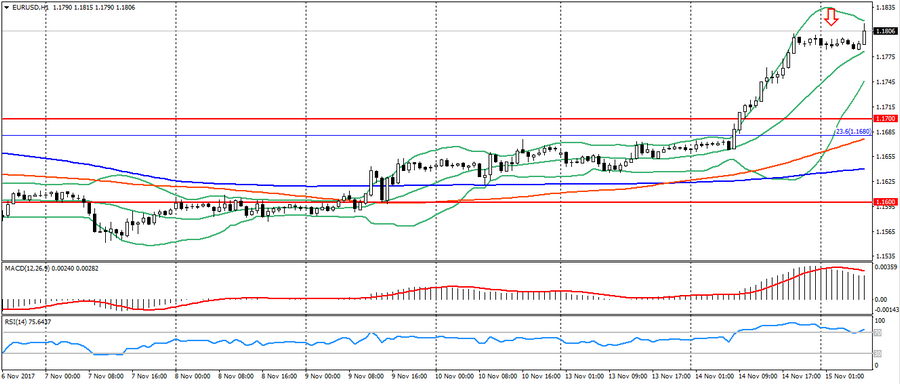
- Support levels: 1.1700 (August 2015 maximum), 1.1600 (2016 maximum), 1.1470.
- Resistance levels: 1.2000, 1.2100, 1.2270 (November 2014 minimum).
- Computer analysis: MACD (signal – downward motion): the indicator is higher than 0, the signal line has left the body of the histogram. RSI is in the overbought zone. Bollinger Bands (period 20): neutral, declining volatility.
- The main recommendation: sale entry is started from 1.1800 (Fibo. 23.6 from the low of December 2016), 1.1840, 1.1860.
- Alternative recommendation: buy entry is started from 1.1760, 1.1720 (MA 200 on H4), 1.1700.
The euro is trading with a strengthening on positive data on the euro area and the weakness of the American. Also, this pair remains overbought, which as a result can cause correction from the resistance levels.
GBP USD (current price: 1.3170)
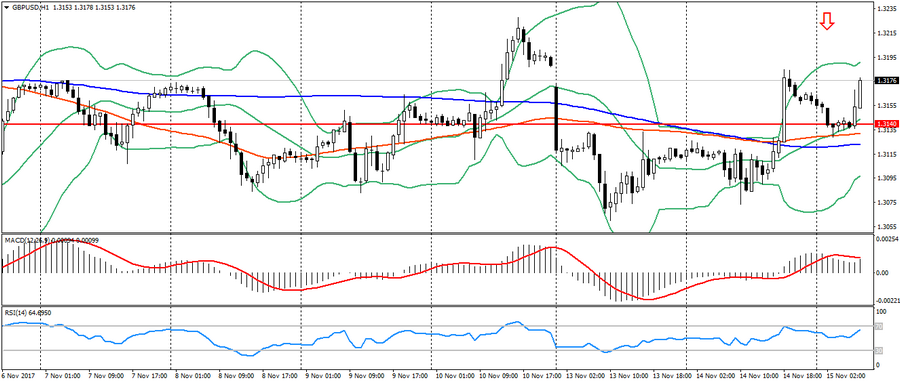
- Support levels: 1.3140, 1.2900, 1.2740 (August 2017 minimum).
- Resistance levels: 1.3500, 1.3660, 1.3830 (February 2016 minimum).
- Computer analysis: MACD (signal – downward motion): the indicator is higher than 0, the signal line has left the body of the histogram. RSI is in the neutral zone. Bollinger Bands (period 20): neutral, declining volatility.
- The main recommendation: sale entry is started from 1.3160, 1.3190, 1.3220.
- Alternative recommendation: buy entry is started from 1.3120 (MA 200), 1.3090, 1.3060.
The British pound also strengthened early in the day on the weakness of the US dollar, but the overall dynamics of the pair is limited by sideways trend.
USD CHF (current price: 0.9970)
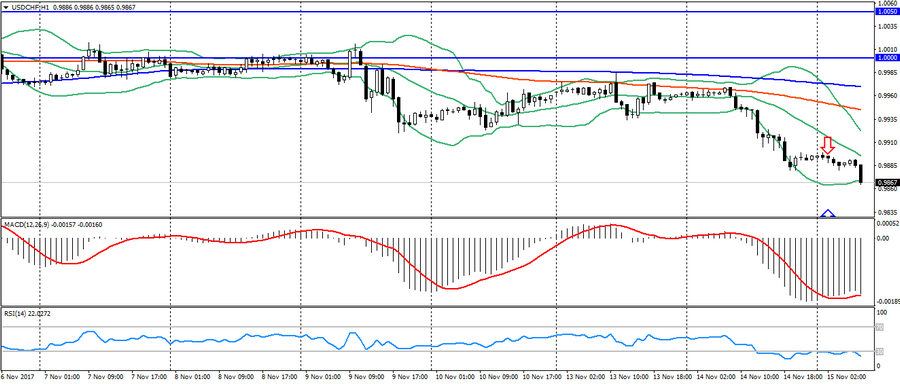
- Support levels: 0.9700, 0.9600, 0.9530.
- Resistance levels: 1.0000, 1.0050, 1.0100 (May maximum).
- Computer analysis: MACD (signal – upward motion): the indicator is below 0, the signal line is in the body of the histogram. RSI is in the oversold zone. Bollinger Bands (period 20): oversold, growing volatility.
- The main recommendation: sale entry is started from 0.9920, 0.9950 (MA 100), 0.9970 (MA 200).
- Alternative recommendation: buy entry is started from 0.9870, 0.9860 (MA 200 on H4), 0.9830.
The Swiss franc also is growing on the overall decline of the American and the flight of investors from risks.
USD JPY (current price: 112.90)
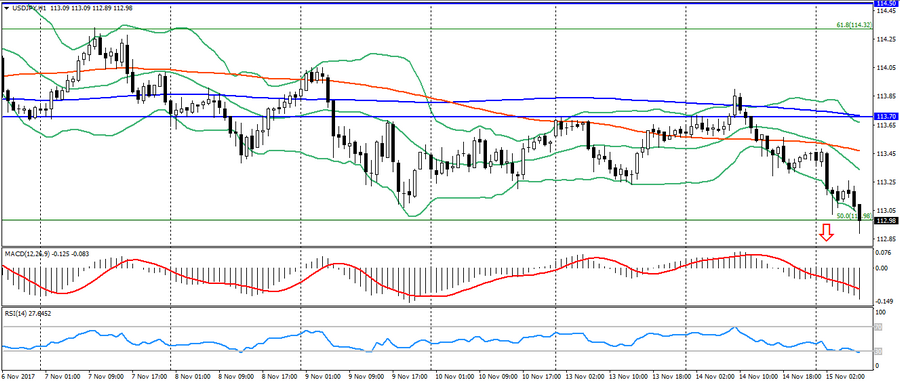
- Support levels: 108.90, 108.10 (April 2017 minimum), 107.30 (2017 minimum).
- Resistance levels: 113.70, 114.50 (July 2017 maximum), 115.00.
- Computer analysis: MACD (signal – downward motion): the indicator is below 0, the signal line is in the body of the histogram. RSI is in the oversold zone. Bollinger Bands (period 20): oversold, growing volatility.
- The main recommendation: sale entry is started from 113.40, 113.70, 114.10.
- Alternative recommendation: buy] entry is started from 112.90 (Fibo. 50.0 from the maximum of December 2016), 112.70, 112.50.
The Japanese yen is also continuing to strengthen its position on positive data on Japan and flight from risks.
USD CAD (current price: 1.2720)
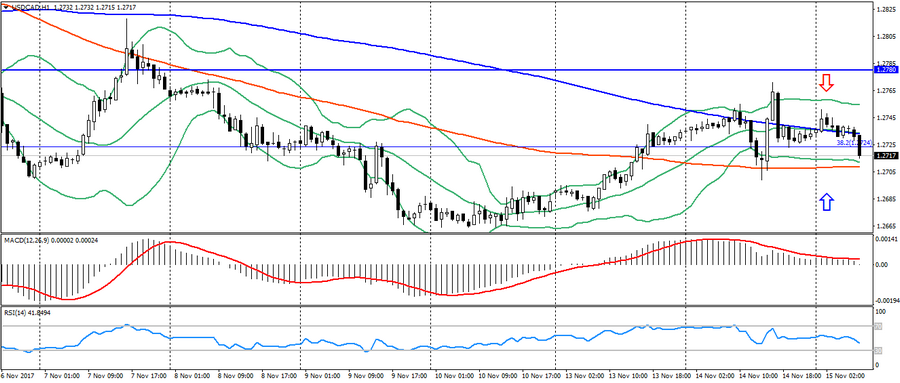
- Support levels: 1.2200, 1.2060 (2017 minimum), 1.1950 (2015 minimum).
- Resistance levels: 1.2780 (August 2017 maximum), 1.3000, 1.3160.
- Computer analysis: MACD (signal – downward motion): the indicator is higher than 0, the signal line has left the body of the histogram. RSI is in the neutral zone. Bollinger Bands (period 20): neutral, growing volatility.
- The main recommendation: ]sale entry is started from 1.2750 (MA 200), 1.2780, 1.2820.
- Alternative recommendation: buy entry is started from 1.2710 (MA 100), 1.2680, 1.2650.
The Canadian dollar strengthened slightly at the beginning of the European session, but the overall dynamics of the pair continues to be limited by an uptrend.
AUD USD (current price: 0.7580)
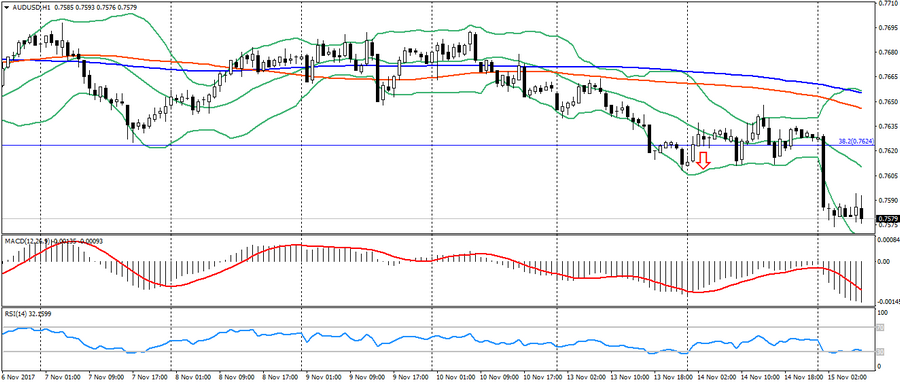
- Support levels: 0.7740, 0.7320 (2017 minimum), 0.7120.
- Resistance levels: 0.8120 (2017 maximum), 0.8200, 0.8290 (2014 maximum).
- Computer analysis: MACD (signal – downward motion): the indicator is below 0, the signal line is in the body of the histogram. RSI is in the oversold zone. Bollinger Bands (period 20): neutral, declining volatility.
- The main recommendation: sale entry is started from 0.7600, 0.7630 (Fibo, 38.2 from the low of 2016), 0.7650.
- Alternative recommendation: buy entry is started from 0.7550, 0.7530, 0.7500.
The Australian remains under pressure of data on Australia and the persistence of negative sentiment in the market.
NZD USD (current price: 0.6880)
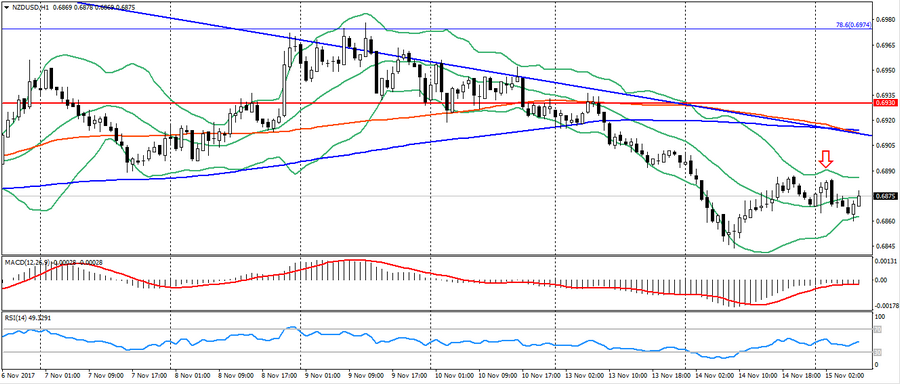
- Support levels: 0.7000, 0.6930, 0.6820 (the minimum of the current year).
- Resistance levels: 0.7380, 0.7450, 0.7550 (2017 maximum).
- Computer analysis: MACD (signal – downward motion): the indicator is below 0, the signal line is in the body of the histogram. RSI is in the neutral zone. Bollinger Bands (period 20): neutral, low volatility.
- The main recommendation: sale entry is started from 0.6880, 0.6900 (MA 200), 0.6930.
- Alternative recommendation: buy entry is started from 0.6850, 0.6820 (October minimum), 0.6800.
The New Zealand dollar is trading near the daily low, thereby restraining itself after a decline.
XAU USD (current price: 1281.00)
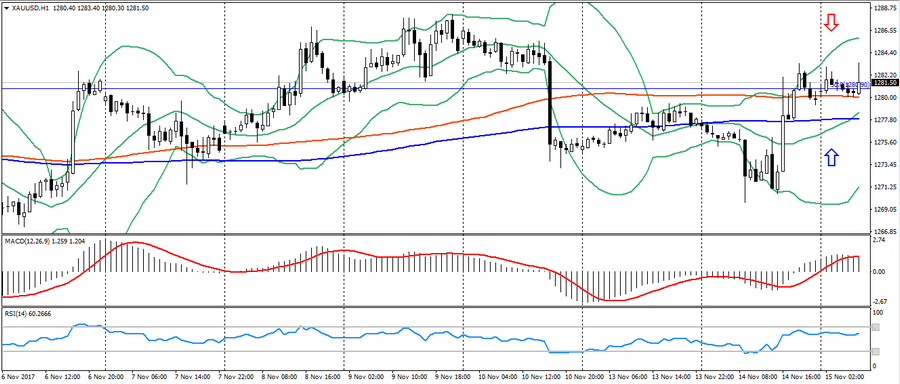
- Support levels: 1250.00, 1226.00, 1200.00.
- Resistance levels: 1340.00, 1355.00, 1374.00 (2016 maximum).
- Computer analysis: MACD (signal – upward motion): the indicator is above 0, the signal line is in the body of the histogram. RSI is in the neutral zone. Bollinger Bands (period 20): neutral, declining volatility.
- The main recommendation: sale entry is started from 1281.00 (Fibo. 50.0 from the July low), 1284.00, 1287.00.
- Alternative recommendation: buy entry is started from 1278.00 (MA 200), 1274.00, 1270.00.
Gold is trading at the opening of the day, thereby adjusting after yesterday’s growth and retaining the potential to strengthen.