
Тechnical analysis of currency pairs (Anton Hanzenko)
EUR USD (current price: 1.1610)
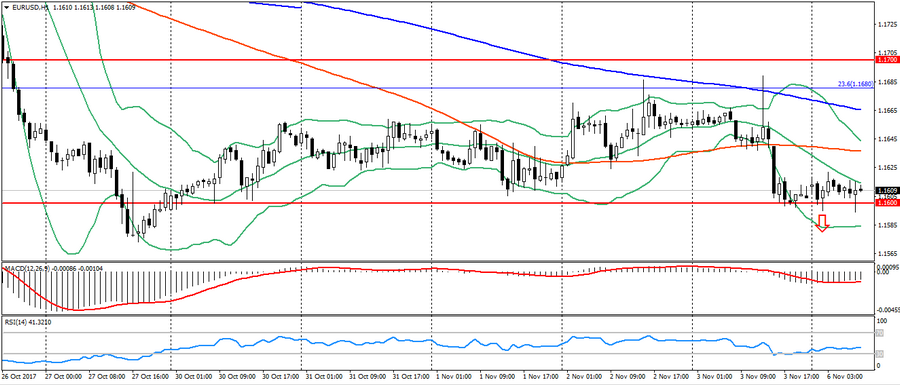
- Support levels: 1.1700 (August 2015 maximum), 1.1600 (2016 maximum), 1.1470.
- Levels of resistance: 1.2000, 1.2100, 1.2270 (November 2014 minimum).
- Computer analysis: MACD (signal – upward motion): the indicator is below 0, the signal line has left the body of the histogram. RSI is in the neutral zone. Bollinger Bands (period 20): neutral, declining volatility.
- The main recommendation: sale entry is started from 1.1640 (MA 100), 1.1660 (MA 200), 1.1680 (Fibo. 23.6 from December 2016).
- Alternative recommendation: buy entry is started from 1.1600 (strong psychology), 1.1580, 1.1550.
The pair EUR/USD is trading in a sideways trend after Friday’s decline, continuing to be limited to the side channel. Given the noticeable oversold, one should expect correction with attempts at growth, but the pair’s dynamics continue to be downward with support at 1.1600.
GBP USD (current price: 1.3080)
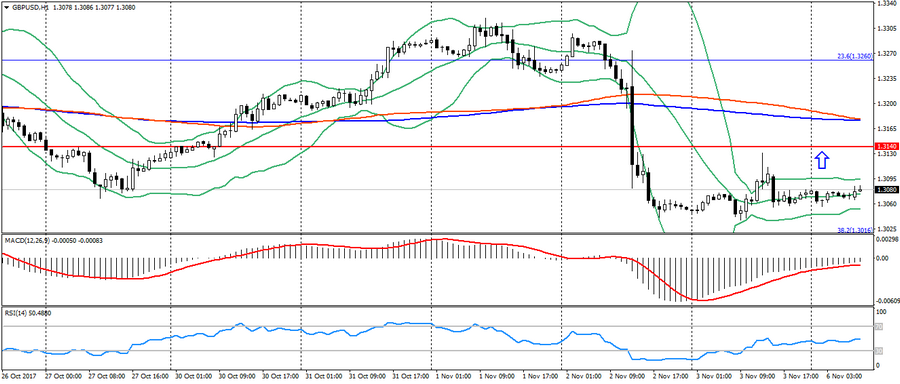
- Support levels: 1.3140, 1.2900, 1.2740 (August 2017 minimum).
- Resistance levels: 1.3500, 1.3660, 1.3830 (February 2016 minimum).
- Computer analysis: MACD (signal – upward motion): the indicator is below 0, the signal line has left the body of the histogram. RSI is in the neutral zone. Bollinger Bands (period 20): neutral, low volatility.
- The main recommendation: sale entry is started from 1.3100, 1.3140, 1.3180 (MA 200).
- Alternative recommendation: buy entry is started from 1.3050, 1.3020 (Fibo. 38.1 from the January low), 1.3000.
The British pound is trading in the consolidation zone after a decline last week, but retains the potential for correction.
USD CHF (current price: 1.0020)
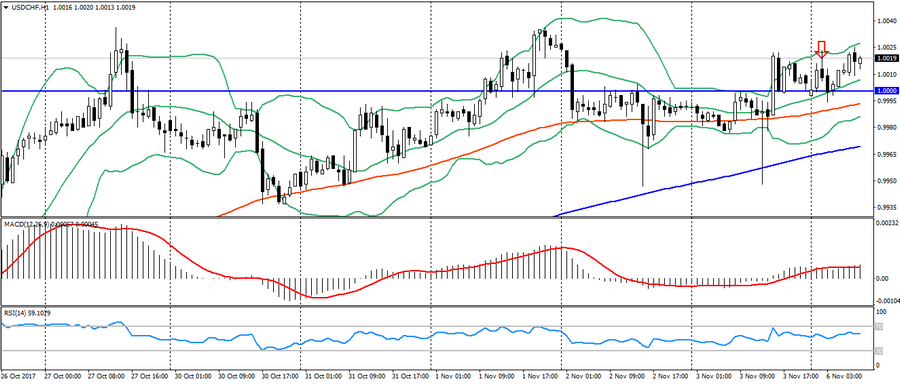
- Support levels: 0.9700, 0.9600, 0.9530.
- Resistance levels: 1.0000, 1.0050, 1.0100 (May maximum).
- Computer analysis: MACD (signal – upward motion): the indicator is above 0, the signal line is in the body of the histogram. RSI is in the neutral zone. Bollinger Bands (period 20): neutral, declining volatility.
- The main recommendation: sale entry is started from 1.0030, 1.0050, 1.0080.
- Alternative recommendation: buy entry is started from 1.0000, 0.9980, 0.9960 (MA 200).
The Swiss franc weakened at the beginning of the day on positive sentiments, but the upward dynamics of the pair will be limited to recent highs.
USD JPY (current price: 114.20)
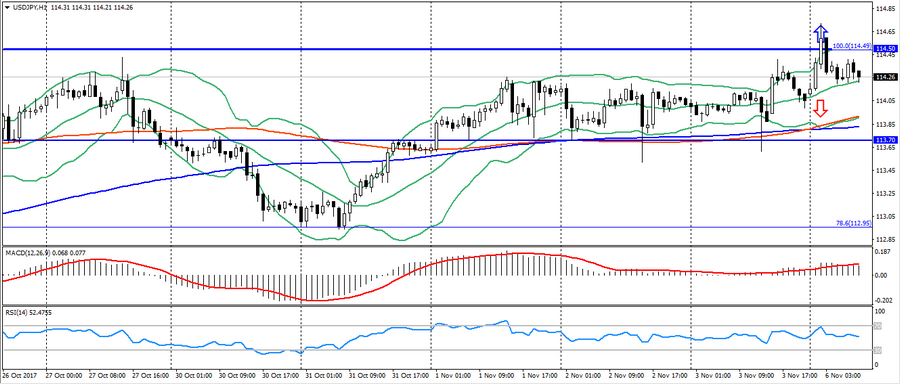
- Support levels: 108.90, 108.10 (April 2017 minimum), 107.30 (2017 minimum).
- Resistance levels: 113.70, 114.50 (July 2017 maximum), 115.00.
- Computer analysis: MACD (signal – upward motion): the indicator is above 0, the signal line is in the body of the histogram. RSI is in the neutral zone. Bollinger Bands (period 20): neutral, declining volatility.
- The main recommendation: sale entry is started from 114.50, 114.70 (July maximum), 115.00.
- Alternative recommendation: buy entry is started from 114.00, 113.80 (MA 200), 113.70.
The Japanese yen is trading in a sideways trend after the morning decline on the comments of the head of the Bank of Japan.
USD CAD (current price: 1.2760)
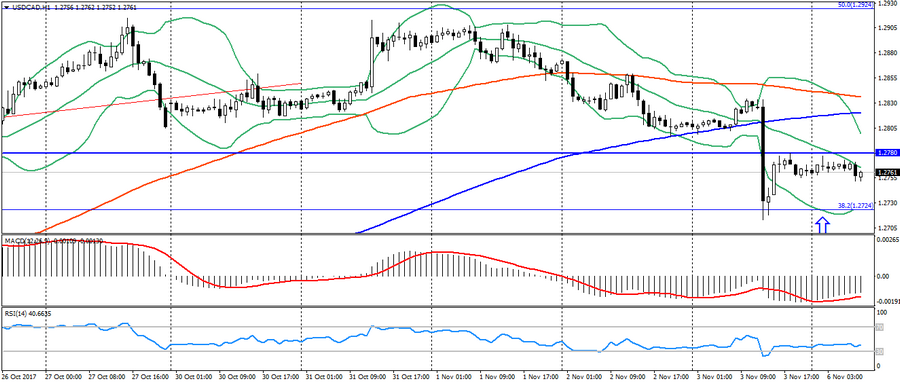
- Support levels: 1.2200, 1.2060 (2017 minimum), 1.1950 (2015 minimum).
- Resistance levels: 1.2780 (August 2017 maximum), 1.3000, 1.3160.
- Computer analysis: MACD (signal – upward motion): the indicator is below 0, the signal line has left the body of the histogram. RSI is in the neutral zone. Bollinger Bands (period 20): neutral, declining volatility.
- The main recommendation: sale entry is started from 1.2800, 1.2820 (MA 200), 1.2860.
- Alternative recommendation: buy entry is started from 1.2750, 1.2730 (Fibo. 38.2 from the May maximum), 1.2700.
The Canadian dollar remains under pressure amid the American, but further decline is limited by oversold.
AUD USD (current price: 0.7650)
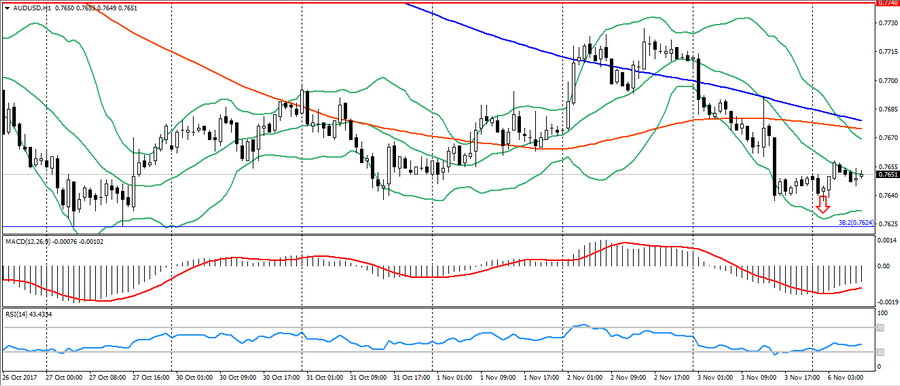
- Support levels: 0.7740, 0.7320 (at least 2017), 0.7120.
- Resistance levels: 0.8120 (2017 maximum), 0.8200, 0.8290 (2014 maximum).
- Computer analysis: MACD (signal – upward motion): the indicator is below 0, the signal line has left the body of the histogram. RSI is in the neutral zone. Bollinger Bands (period 20): oversold, declining volatility.
- The main recommendation: sale entry is started from 0.7660, 0.7680 (MA 200), 0.7000.
- Alternative recommendation: buy entry is started from 0.7640, 0.7620 (Fibo, 38.2 from the low of January 2016), 0.7600.
The Australian slightly strengthened early in the day on data on Australia, but retains the potential to decline
NZD USD (current price: 0.6880)
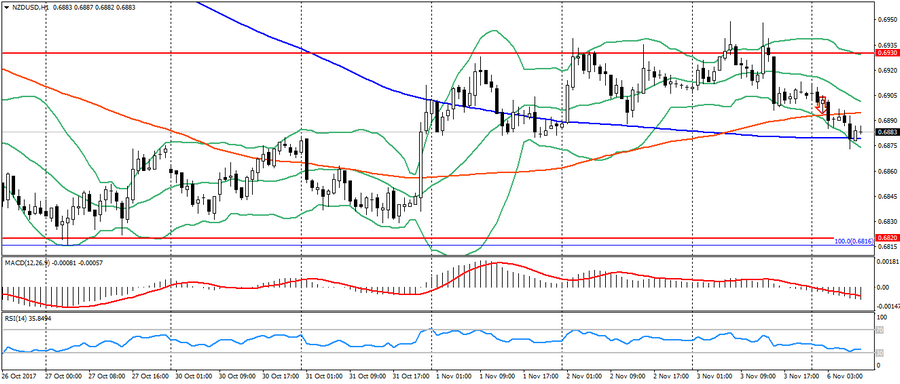
- Support levels: 0.7000, 0.6930, 0.6820 (the minimum of the current year).
- Resistance levels: 0.7380, 0.7450, 0.7550 (2017 maximum).
- Computer analysis: MACD (signal – downward motion): the indicator is below 0, the signal line is in the body of the histogram. RSI is in the neutral zone. Bollinger Bands (period 20): neutral, declining volatility.
- The main recommendation: sale entry is started from 0.6910, 0.6930, 0.6950.
- Alternative recommendation: buy entry is started from 0.6880, 0.6860, 0.6820.
The New Zealand dollar is trading lower on rising pressure from the US dollar.
XAU USD (current price: 1269.00)
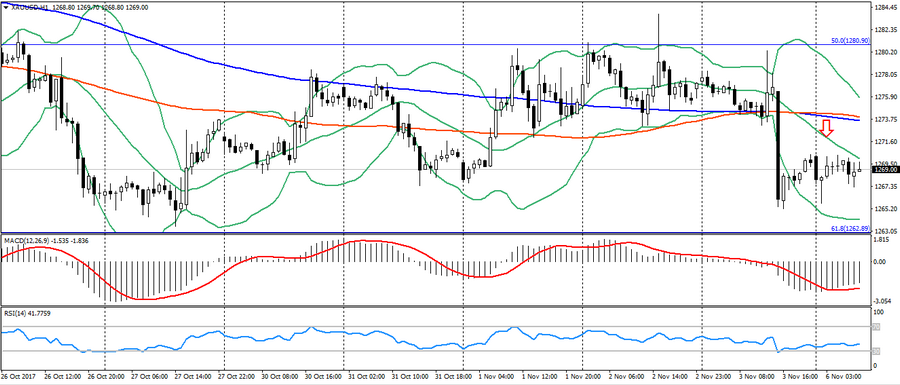
- Support levels: 1250.00, 1226.00, 1200.00.
- Resistance levels: 1340.00, 1355.00, 1374.00 (2016 maximum).
- Computer analysis: MACD (signal – upward motion): the indicator is below 0, the signal line is in the body of the histogram. RSI is in the neutral zone. Bollinger Bands (period 20): neutral, declining volatility.
- The main recommendation: sale entry is started from 1272.00, 1274.00 (MA200), 1278.00.
- Alternative recommendation: buy entry is started from 1265.00, 1262.00 (Fibo. 61.8 from the July’s low), 1258.00.
Gold remains under pressure of a downtrend, but is limited to slight oversold.