
Technical Analysis of Oil (Alexander Sivtsov)
Oil is traded above the zero mark in the Asian session.
The Brent graph (current price: $ 6507.80 per 100 barrels)
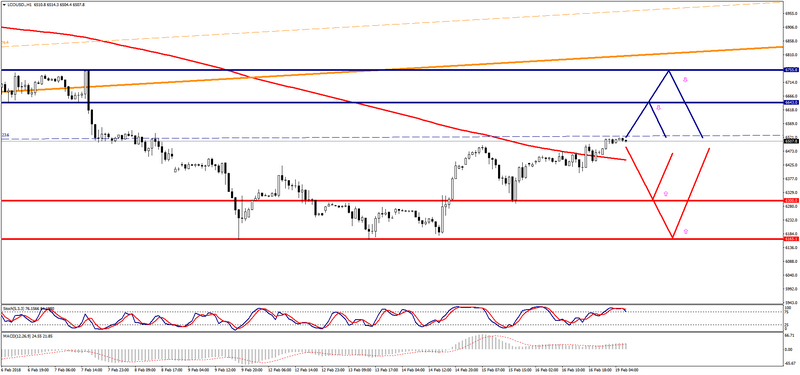
The Brent brand is traded with a plus during the Asian session.
- Resistance 1: From $ 6643.00 (February 6 minimum)
- Resistance 2: From $ 6755.80 (February 7 maximum)
- Support 1: From $ 6300.00 (psychological level)
- Support 2: From $ 6165.10 (February 13 minimum)
Computer analysis: The Stochastic Oscillator movings on the chart of H1 indicate overbought of the instrument, so there may be some reduction in the price of Brent.
The WTI graph (current price: $ 6218.00 per 100 barrels)
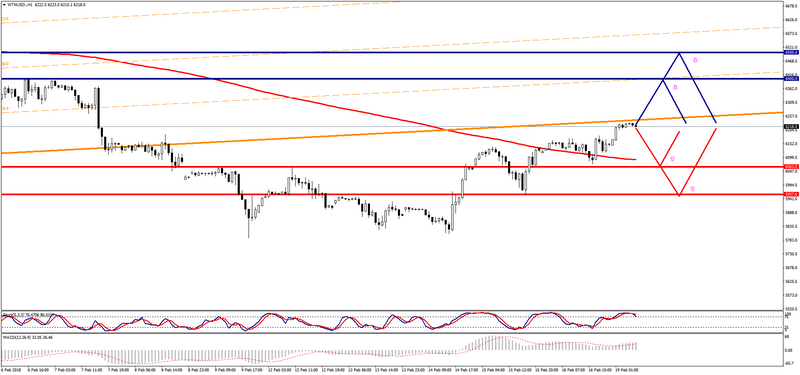
The WTI brand is traded above the zero mark during the Asian session.
- Resistance 1: From $ 6400.00 (psychological level)
- Resistance 2: From $ 6500.00 (psychological level)
- Support 1: From $ 6063.00 (technical level)
- Support 2: From $ 5957.60 (February 15 minimum)
Computer analysis: The Stochastic Oscillator movings on the H1 chart indicate overbought of the instrument, one should expect a certain reduction in the price of WTI.