
Technical Analysis of Oil (Alexander Sivtsov)
Oil shows mixed dynamics during the Asian session.
The Brent graph (current price: $ 6971.20 per 100 barrels)
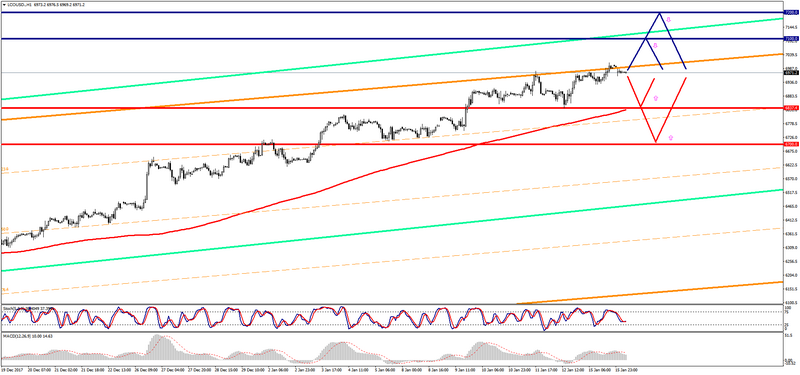
The Brent brad is traded below the zero mark during the Asian session.
- Resistance 1: From $ 7100.00 (psychological level)
- Resistance 2: From $ 7200.00 (psychological level)
- Support 1: From $ 6837.40 (January 12 minimum)
- Support 2: From $ 6700.00 (psychological level)
Computer analysis: The Stochastic Oscillator movings on the H4 chart indicate overbought of the instrument. That is why the Brent price may decline.
The WTI graph (current price: $ 6437.30 per 100 barrels)
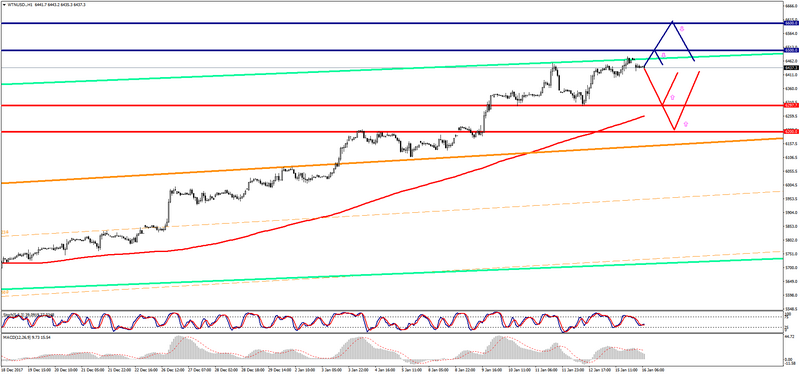
The WTI brand is traded with a plus during the Asian session.
- Resistance 1: From $ 6500.00 (psychological level)
- Resistance 2: From $ 6600.00 (psychological level)
- Support 1: From $ 6297.70 (January 12 minimum)
- Support 2: From $ 6200.00 (psychological level)
Computer analysis: The Stochastic Oscillator movings on the H4 chart indicate an overbought of the instrument, which is why there may be some reduction in the price of WTI.