
Technical Analysis of Oil (Alexander Sivtsov)
Oil shows negative dynamics during the Asian session.
The Brent graph (current price: $ 6318.70 per 100 barrels)
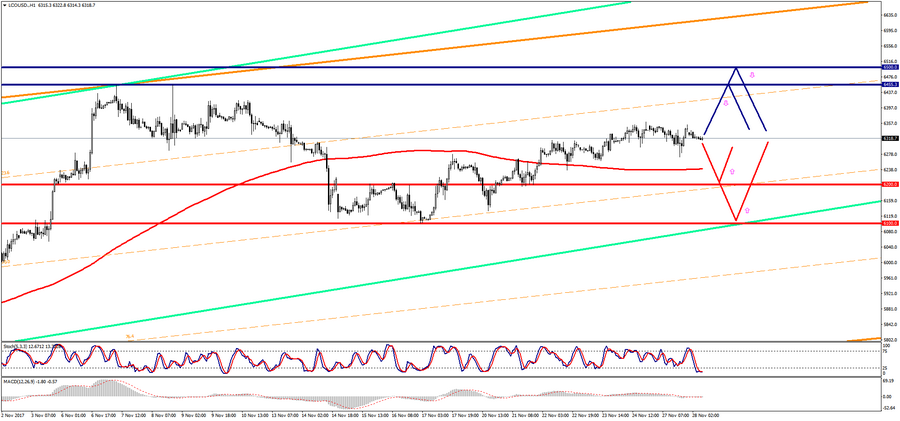
The Brent brand is trading below the zero mark during the Asian session.
- Resistance 1: From $ 6455.30 (November 8 maximum)
- Resistance 2: From $ 6500.00 (psychological level)
- Support 1: From $ 6200.00 (psychological level)
- Support 2: From $ 6100.00 (psychological level)
Computer analysis: The Stochastic Oscillator movings on D1 chart indicate overbought of the instrument, so the Brent price may decline, pending publication of data on US oil reserves by API.
The graph of the brand WTI (current price: $ 5775.90 per 100 barrels)
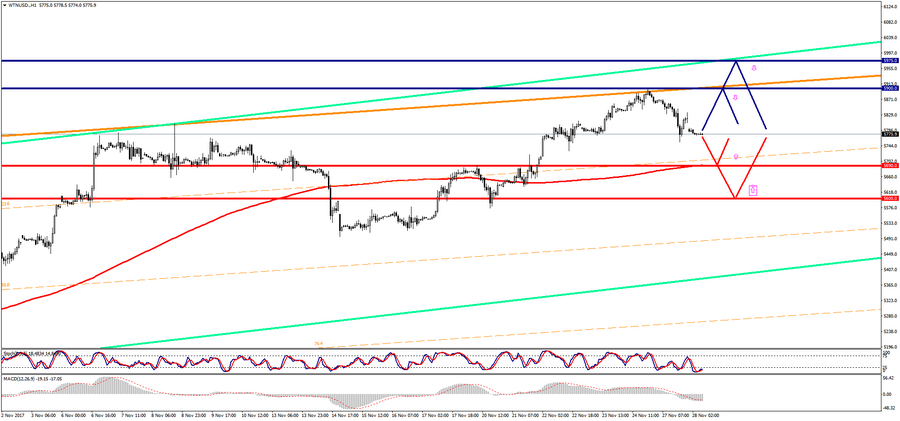
The WTI brand is trading with a minus during the Asian session.
- Resistance 1: From $ 5900.00 (psychological level)
- Resistance 2: From $ 5975.00 (resistance line of Up channel on H1)
- Support 1: From $ 5690.00 (MA 200 on H1)
- Support 2: From $ 5600.00 (psychological level)
Computer analysis: The Stochastic Oscillator movings on D1 chart indicate overbought of the instrument, which is why the reduction of the WTI brand price is possible in anticipation of publication of data on oil reserves in the US.