
Technical Analysis of Oil (Alexander Sivtsov)
Oil is trading in a narrow range during the Asian session.
The Brent graph (current price: $ 6248.60 per 100 barrels)
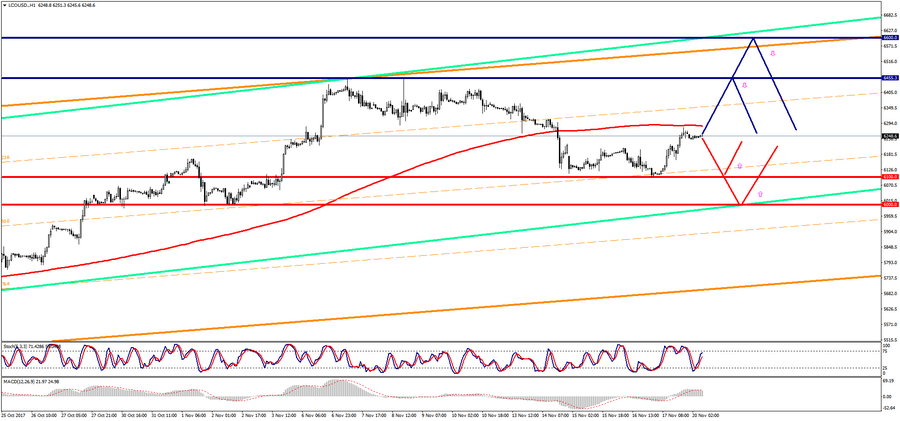
The Brent is trading just below the zero mark during the Asian session.
- Resistance 1: From $ 6455.30 (November 8 maximum)
- Resistance 2: From $ 6600.00 (psychological level)
- Support 1: From $ 6100.00 (psychological level)
- Support 2: From $ 6000.00 (psychological level)
Computer analysis: The Stochastic Oscillator movings on the H4 chart indicate the overbought of the instruments, against which one should expect a decrease in Brent price in the course of trading.
The WTI graph (current price: $ 5674.10 per 100 barrels)
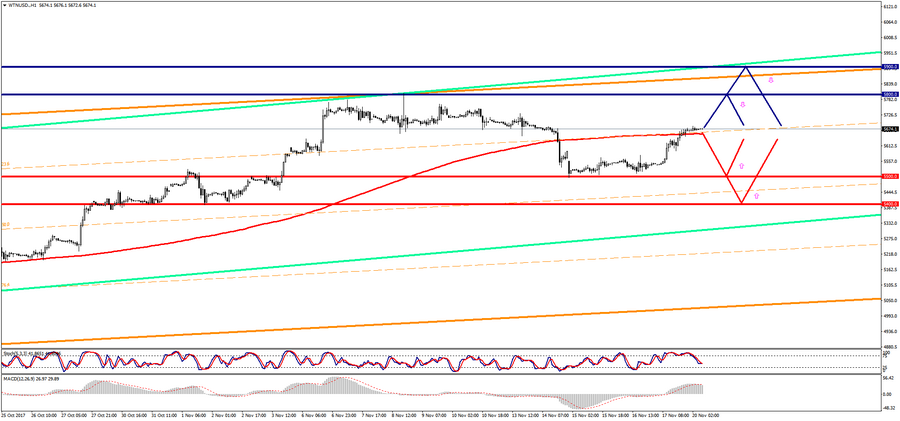
The WTI is trading with a small minus during the Asian session.
- Resistance 1: From $ 5800.00 (psychological level)
- Resistance 2: From $ 5900.00 (psychological level)
- Support 1: From $ 5500.00 (psychological level)
- Support 2: From $ 5400.00 (psychological level)
Computer analysis: The Stochastic Oscillator movings on the H4 chart indicate the overbought of the instruments, which is why the reduction of the WTI oil price is possible.