
Technical analysis of cross-rates. (Anton Hanzenko)
EUR GBP (current price: 0.8900)
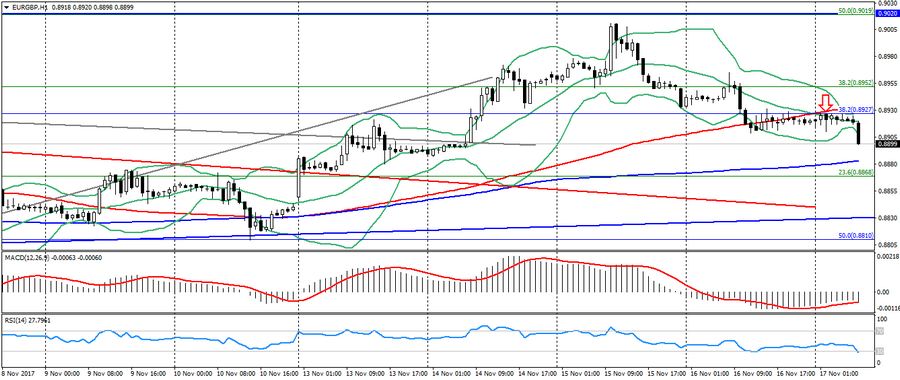
- Support levels: 0.8730 (minimum of the last months), 0.8650, 0.8530.
- Resistance levels: 0.9020, 0.9170, 0.9300 (the maximum of the current year).
- Computer analysis: MACD (signal – downward motion): the indicator is below 0, the signal line is in the body of the histogram. RSI is in the oversold zone. Bollinger Bands (period 20): oversold, growing volatility.
- The main recommendation: sale entry is started from 0.8930 (Fibo. 38.2 from the April’s low), 0.8950, 0.8980.
- Alternative recommendation: buy entry is started from 0.8880 (MA 200), 0.8850, 0.8830 (MA 100).
This cross accelerated the decline while working out the “head and shoulders” figure.
EUR JPY (current price: 132.70)
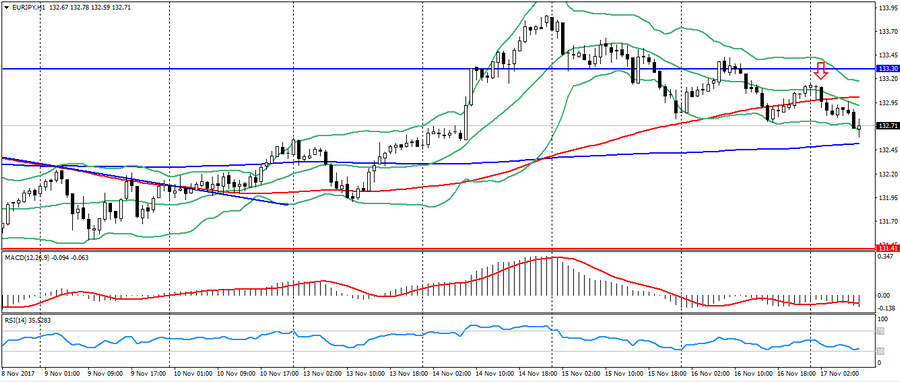
- Support levels: 131.40 (minimum of the last months), 130.50, 129.80 (Fibo. 23.6 from the low of the current year).
- Resistance levels: 133.30, 134.40 (the maximum of the current year), 135.00.
- Computer analysis: MACD (signal – downward motion): the indicator is below 0, the signal line is in the body of the histogram. RSI is in the neutral zone. Bollinger Bands (period 20): neutral, declining volatility.
- The main recommendation: sale entry is started from 133.10, 133.30, 133.60.
- Alternative recommendation: buy entry is started from 132.50 (MA 200), 132.20, 132.00.
The Euro yen remains in the correction phase after growth and is limited by a downward trend.
GBP JPY (current price: 148.90)
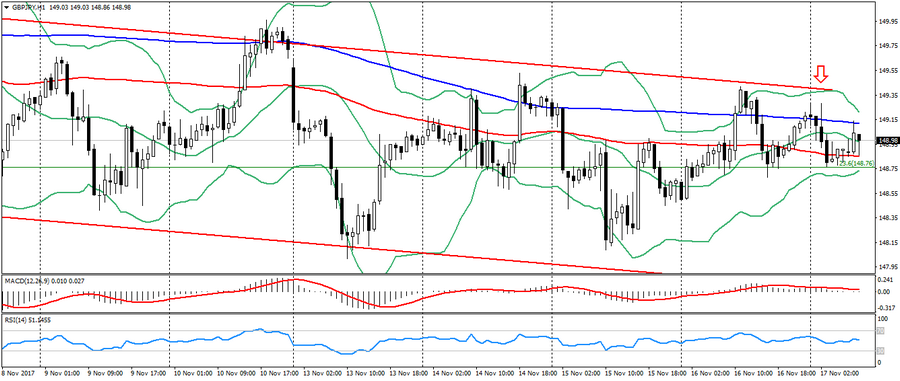
- Support levels: 147.00 (minimum of last months), 144.20 (Fibo. 50.0 from the low of April), 141.50.
- Resistance levels: 151.30, 152.80 (the maximum of the current year), 155.40.
- Computer analysis: MACD (signal-flat): the indicator is near 0. RSI is in the neutral zone. Bollinger Bands (period 20): neutral, declining volatility.
- The main recommendation: sale entry is started from 149.00 (MA 100), 149.30 (MA 200), 149.60.
- Alternative recommendation: buy entry is started from 148.60, 148.20, 147.90.
The pound is trading in an established sideways trend.
EUR CHF (current price: 1.1680)
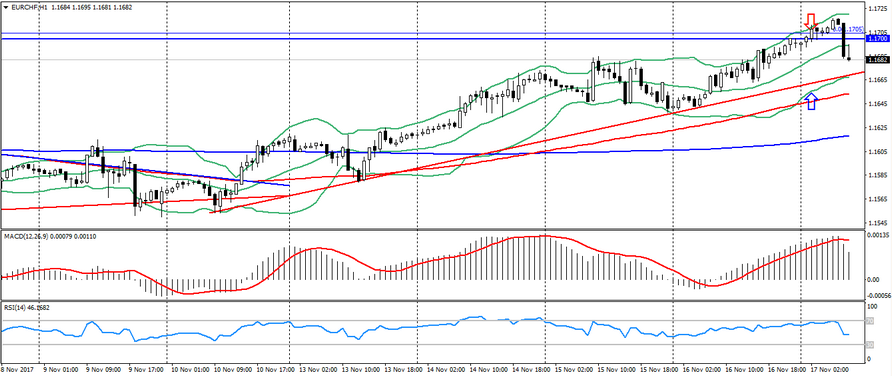
- Support levels: 1.1500, 1.1450 (Fibo, 23.6 from the low of the current year), 1.1350.
- Resistance levels: 1.1700 (the maximum of the current year), 1.1750, 1.1800.
- Computer analysis: MACD (signal – downward motion): the indicator is higher than 0, the signal line has left the body of the histogram. RSI is in the neutral zone. Bollinger Bands (period 20): neutral, low volatility.
- The main recommendation: sale entry is started from 1.1670 (local maximum), 1.1700, 1.1730.
- Alternative recommendation: buy entry is started from 1.1630, 1.1600 (MA 100), 1.1580.
The euro franc pair was under pressure due to the flight from risks, but is also limited by an uptrend.