
Technical analysis of cross-rates. (Anton Hanzenko)
EUR GBP (current price: 0.8900)
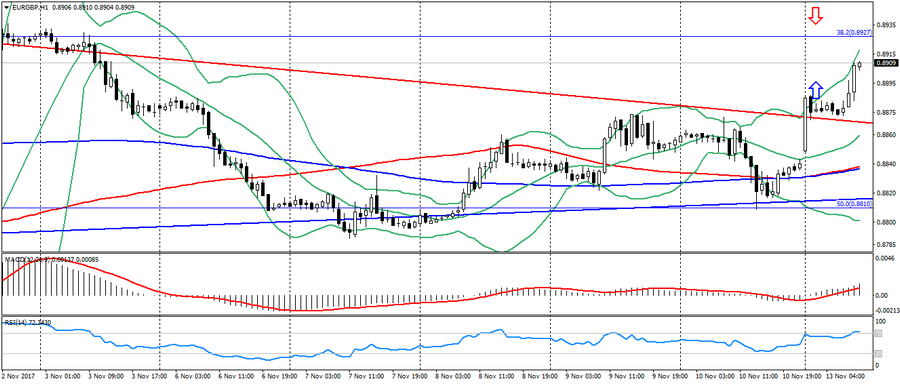
- Support levels: 0.8730 (minimum of the last months), 0.8650, 0.8530.
- Resistance levels: 0.9020, 0.9170, 0.9300 (the maximum of the current year).
- Computer analysis: MACD (signal – upward motion): the indicator is above 0, the signal line is in the body of the histogram. RSI is in the overbought zone. Bollinger Bands (period 20): neutral, high volatility.
- The main recommendation: sale entry is started from 0.8930 (Fibo. 38.2 from the April’s low), 0.8950, 0.8970.
- Alternative recommendation: buy entry is started from 0.8880, 0.8850, 0.8830 (MA 200).
The euro has received notable support due to the weakness of the pound because of the political crisis in the UK. As a result, this cross was able to break the downtrend. As a result, it opens the way to a significant resistance of 0.8930.
EUR JPY (current price: 132.10)
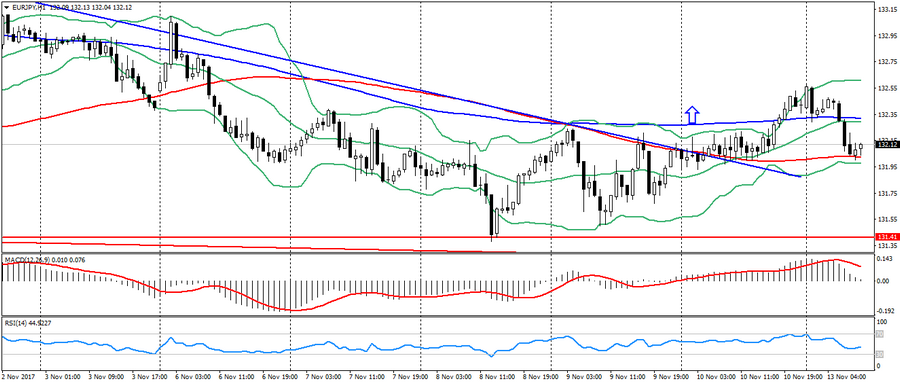
- Support levels: 131.40 (minimum of the last months), 130.50, 129.80 (Fibo. 23.6 from the low of the current year).
- Resistance levels: 133.30, 134.40 (the maximum of the current year), 135.00.
- Computer analysis: MACD (signal – downward motion): the indicator is higher than 0, the signal line has left the body of the histogram. RSI is in the neutral zone. Bollinger Bands (period 20): neutral, high volatility.
- The main recommendation: sale entry is started from 132.30 (MA 200), 132.60, 132.80.
- Alternative recommendation: buy entry is started from 131.90, 131.70, 131.40.
The euro remains under pressure against the yen, following a decline in the pound because of political risks in the UK, which is caused by concerns over negotiations between the EU and the UK.
GBP JPY (current price: 148.20)
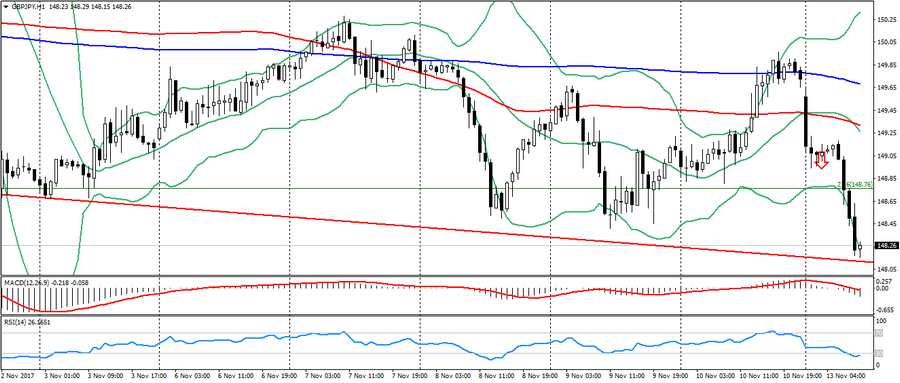
- Support levels: 147.00 (minimum of last months), 144.20 (Fibo. 50.0 from the low of April), 141.50.
- Resistance levels: 151.30, 152.80 (the maximum of the current year), 155.40.
- Computer analysis: MACD (signal – downward motion): the indicator is below 0, the signal line is in the body of the histogram. RSI is in the oversold zone. Bollinger Bands (period 20): oversold, growing volatility.
- The main recommendation: sale entry is started from 148.50 (MA 100), 148.80 (Fibo. 23.6 from the April’s low), 149.20.
- Alternative recommendation: buy entry is started from 148.00, 147.80, 147.50.
The pound is also significantly weakened against the yen (about 140 points) because of political risks in the UK. As a result, this cross-rate returned to the neck level of the “head and shoulders” figure, which was previously discussed in the reviews.
EUR CHF (current price: 1.1600)
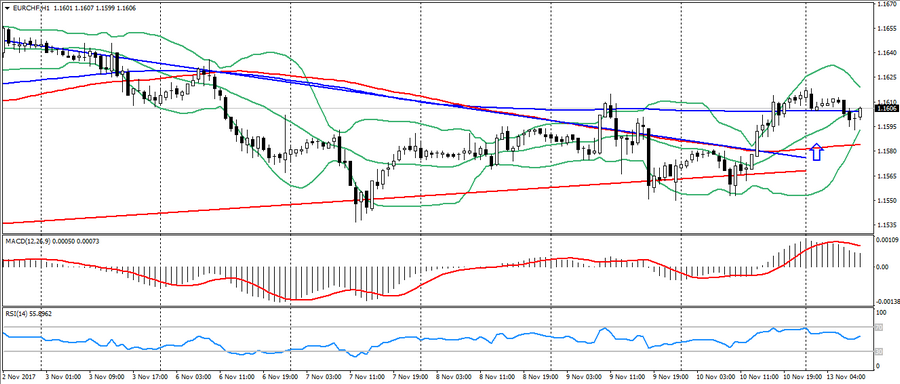
- Support levels: 1.1500, 1.1450 (Fibo. 23.6 from the low of the current year), 1.1350.
- Resistance levels: 1.1700 (the maximum of the current year), 1.1750, 1.1800.
- Computer analysis: MACD (signal – downward motion): the indicator is higher than 0, the signal line has left the body of the histogram. RSI is in the neutral zone. Bollinger Bands (period 20): neutral, low volatility.
- The main recommendation: sale entry is started from 1.1620 (the maximum of the last week), 1.1640, 1.1670.
- Alternative recommendation: buy entry is started from 1.1580 (MA 100), 1.1560, 1.1540 (local minimum).
The euro-franc pair moved into the correction phase after last week’s growth, thereby keeping the overall uptrend across the cross.