
Technical Analysis of Oil (Alexander Sivtsov)
Oil shows mixed dynamics during the Asian session.
Brent graph (current price: $ 68.99)
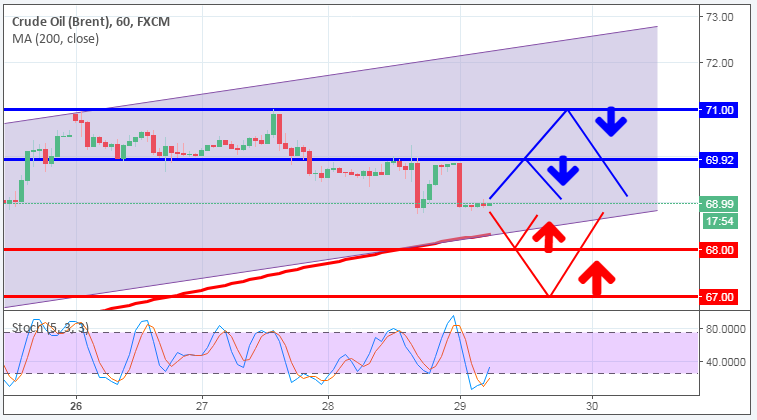
The Brent is traded below the zero mark during the Asian session.
- Resistance 1: From $ 69.92 (technical level)
- Resistance 2: From $ 71.00 (psychological level)
- Support 1: From $ 68.00 (psychological level)
- Support 2: From $ 67.00 (psychological level)
Computer analysis: The Stochastic Oscillator movings on the chart H1 indicate the oversold of the instrument, against which there may be some recovery in the price of Brent.
WTI graph (current price: $ 64.68)
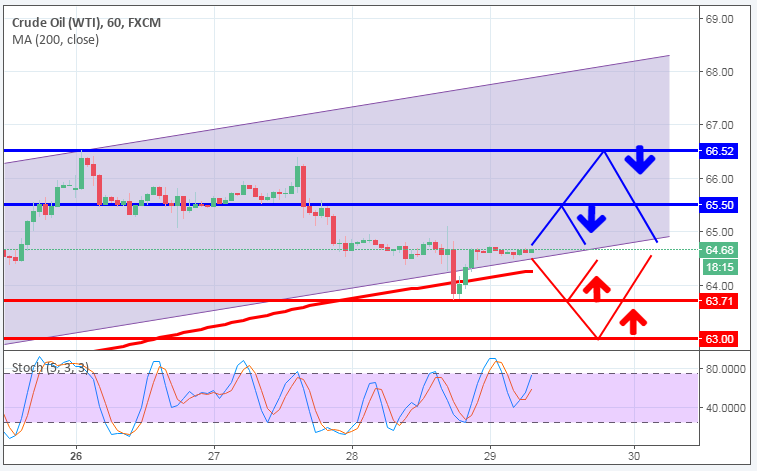
The WTI brand is traded in a narrow range during the Asian session.
- Resistance 1: From $ 65.50 (technical level)
- Resistance 2: From $ 66.52 (March 26 maximum)
- Support 1: From $ 63.71 (March 28 minimum)
- Support 2: From $ 63.00 (psychological level)
Computer analysis: The Stochastic Oscillator movings on the chart H1 are in the neutral zone, in connection with which the consolidation of the price of WTI is expected.