
Technical Analysis of Oil (Alexander Sivtsov)
Oil is traded above the zero mark in the Asian session.
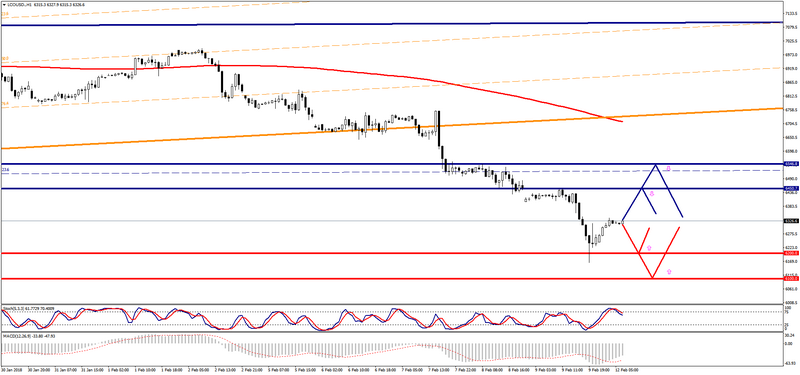
The Brent graph (current price: $ 6326.60 per 100 barrels)
The Brent brand is traded above the zero mark during the Asian session.
- Resistance 1: From $ 6450.70 (February 9 maximum)
- Resistance 2: From $ 6546.80 (February 8 maximum)
- Support 1: From $ 6200.00 (psychological level)
- Support 2: From $ 6100.00 (psychological level)
Computer analysis: The Stochastic Oscillator movings on the H4 chart are in the neutral zone, the formation of a consolidation of the Brent price is possible.
The WTI graph (current price: $ 5966.90 per 100 barrels)

The WTI brand is traded with a plus during the Asian session.
- Resistance 1: From $ 6061.30 (February 9 maximum)
- Resistance 2: From $ 6186.50 (February 8 maximum)
- Support 1: From $ 5800.00 (psychological level)
- Support 2: From $ 5700.00 (psychological level)
Computer analysis: The Stochastic Oscillator movings on the H4 chart are in the neutral zone, so one should expect the consolidation of the WTI price in anticipation of the OPEC report.