
Technical Analysis of Oil (Alexander Sivtsov)
Oil remains positive during the Asian session.
The Brent graph (current price: $ 6977.50 per 100 barrels)
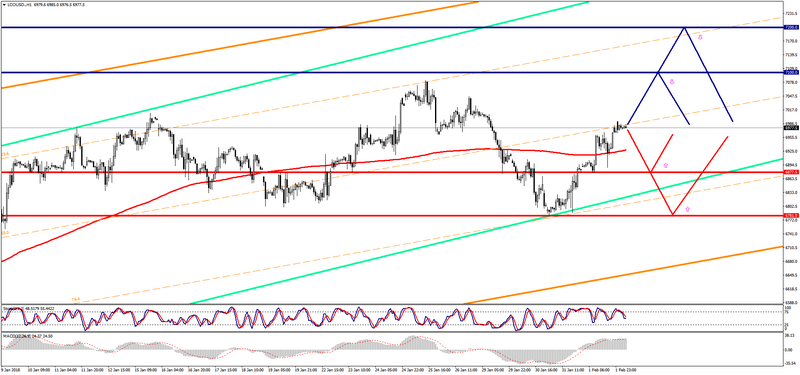
The Brent brand is traded with a plus during the Asian session.
- Resistance 1: From $ 7100.00 (psychological level)
- Resistance 2: From $ 7200.00 (psychological level)
- Support 1: From $ 6877.50 (February 1 minimum)
- Support 2: From $ 6781.00 (January 31 minimum)
Computer analysis: The Stochastic Oscillator movings on the H1 chart are in the neutral zone. The consolidation of the Brent price during the European session is possible.
The WTI graph (current price: $ 6589.50 per 100 barrels)
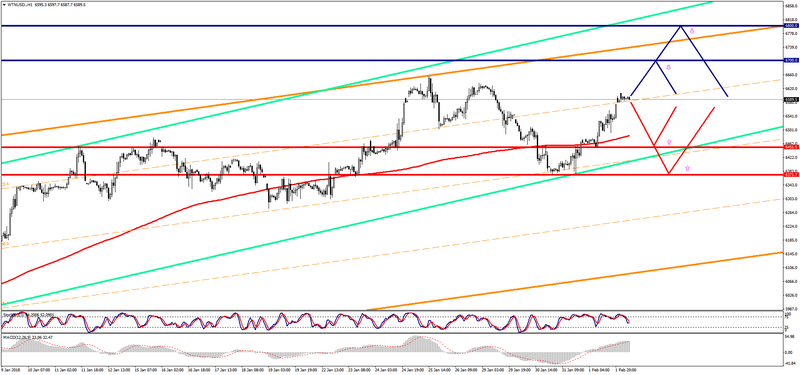
The WTI brand is traded above the zero mark during the Asian session.
- Resistance 1: From $ 6700.00 (psychological level)
- Resistance 2: From $ 6800.00 (psychological level)
- Support 1: From $ 6451.50 (February 1 minimum)
- Support 2: From $ 6,371.70 (January 31 minimum)
Computer analysis: The Stochastic Oscillator movings on the H1 chart are in the neutral zone, so one should expect the movement of WTI price in a narrow range.