
Technical Analysis of Oil (Alexander Sivtsov)
Oil is traded below the zero mark in the Asian session.
The Brent graph (current price: $ 6987.20 per 100 barrels)
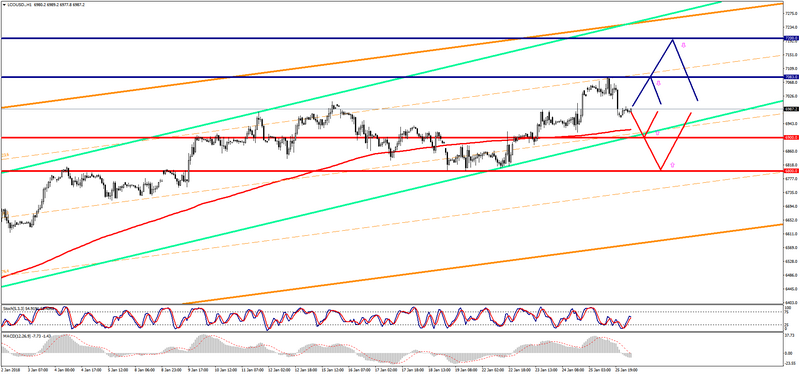
The Brent brand is traded with a small minus during the Asian session.
- Resistance 1: From $ 7083.00 (January 25 maximum)
- Resistance 2: From $ 7200.00 (psychological level)
- Support 1: From $ 6900.00 (psychological level)
- Support 2: From $ 6800.00 (psychological level)
Computer analysis: The Stochastic Oscillator movings on the H1 chart are in the neutral zone, the consolidation of the Brent price is possible.
The WTI graph (current price: $ 6536.50 per 100 barrels)
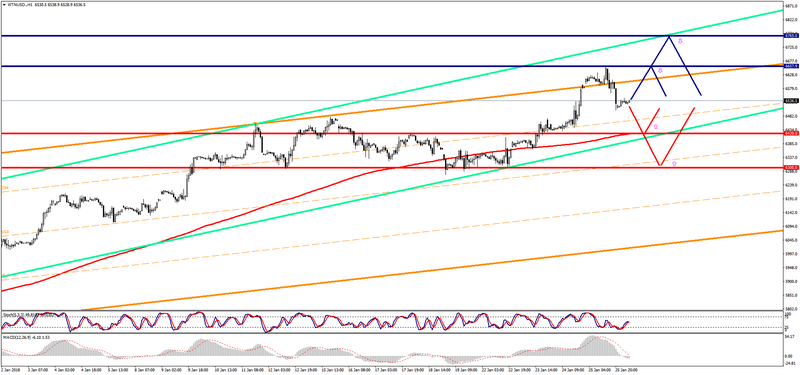
The WTI brand is traded just below the zero mark during the Asian session.
- Resistance 1: From $ 6657.90 (January 25 maximum)
- Resistance 2: With $ 6765.00 (resistance line of Up channel on H1)
- Support 1: From $ 6420.00 (MA 200 on H1)
- Support 2: From $ 6300.00 (psychological level)
Computer analysis: The Stochastic Oscillator movings on the H1 chart are in the neutral zone, so one should expect the WTI price to move in a narrow range.