
Technical Analysis of Oil (Alexander Sivtsov)
Oil is traded near zero marks during the Asian session.
The Brent graph (current price: $ 6950.80 per 100 barrels)
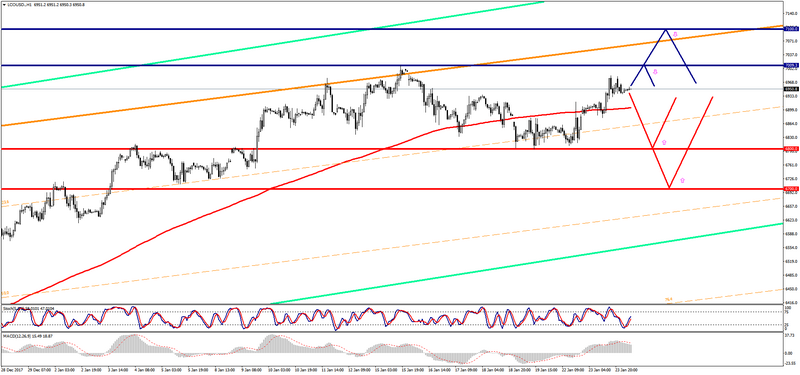
The Brent brand is traded slightly below the zero mark during the Asian session.
- Resistance 1: From $ 7009.30 (January 15 maximum)
- Resistance 2: From $ 7100.00 (psychological level)
- Support 1: From $ 6800.00 (psychological level)
- Support 2: From $ 6700.00 (psychological level)
Computer analysis: The Stochastic Oscillator movings on the H4 chart indicate overbought of the instrument, so there may be some decline in the Brent price.
The WTI graph (current price: $ 6444.20 per 100 barrels)
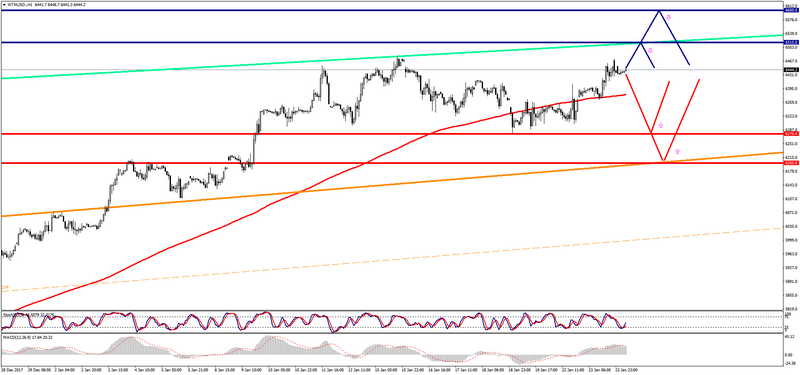
The WTI brand is traded near the zero mark during the Asian session.
- Resistance 1: With $ 6515.00 (resistance line of Up channel on H1)
- Resistance 2: From $ 6600.00 (psychological level)
- Support 1: From $ 6276.40 (January 19 minimum)
- Support 2: From $ 6200.00 (psychological level)
Computer analysis: The Stochastic Oscillator movings on the H4 chart indicate overbought of the instrument, which is why one should expect a downward correction in the WTI price in anticipation of data on oil reserves in the US.