
Technical Analysis of Oil (Alexander Sivtsov)
Oil is traded above the zero mark in the Asian session.
The Brent graph (current price: $ 6957.30 per 100 barrels)

The Brent brand is traded above the zero mark during the Asian session.
- Resistance 1: From $ 7100.00 (psychological level)
- Resistance 2: From $ 7200.00 (psychological level)
- Support 1: From $ 6813.30 (January 4 maximum)
- Support 2: From $ 6700.00 (psychological level)
Computer analysis: The Stochastic Oscillator movings on the charts of H1 and H4 indicate overbought of the instrument, the reduction of the Brent price is possible.
The WTI graph (current price: $ 6429.30 per 100 barrels)
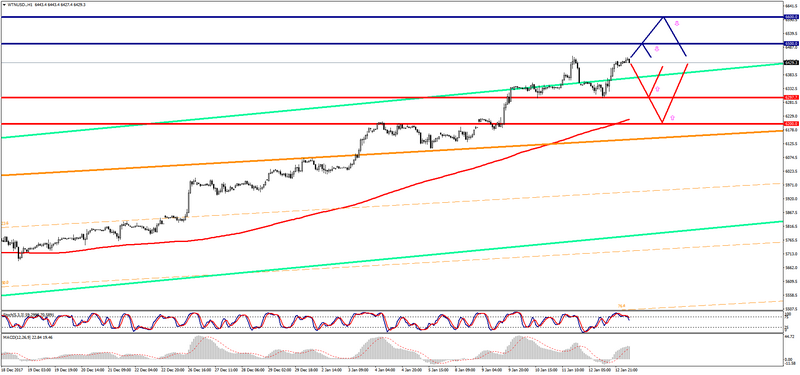
The WTI brand is traded with a plus during the Asian session.
- Resistance 1: From $ 6500.00 (psychological level)
- Resistance 2: From $ 6600.00 (psychological level)
- Support 1: From $ 6297.70 (January 12 minimum)
- Support 2: From $ 6200.00 (psychological level)
Computer analysis: The Stochastic Oscillator movings on the charts of H1 and H4 indicate overbought of the instrument, there may be some reduction in the price of WTI.