
Technical Analysis of Oil (Alexander Sivtsov)
Oil is traded near the zero marks during the Asian session.
The Brent graph (current price: $ 6888.40 per 100 barrels)

The Brent brand is traded below the zero mark during the Asian session.
- Resistance 1: From $ 7000.00 (psychological level)
- Resistance 2: With $ 7073.00 (resistance line of the Up channel on H1)
- Support 1: From $ 6813.30 (January 4 maximum)
- Support 2: From $ 6700.00 (psychological level)
Computer analysis: The Stochastic Oscillator movings on the H1 chart are in the neutral zone, the continuation of the consolidation of the Brent price.
The WTI graph (current price: $ 6335.40 per 100 barrels)
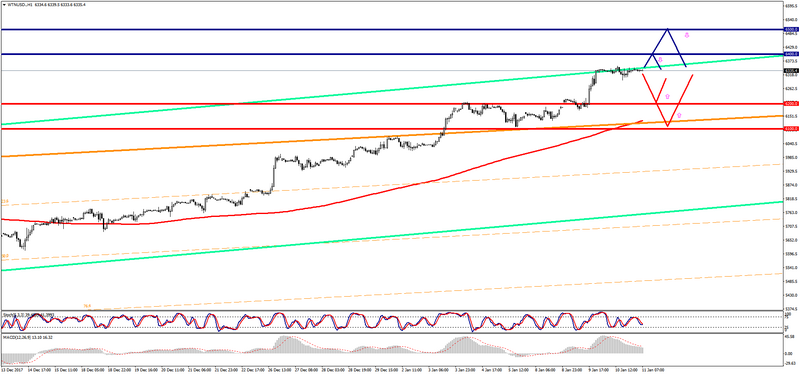
The WTI brand is traded with a small minus during the Asian session.
- Resistance 1: From $ 6400.00 (psychological level)
- Resistance 2: From $ 6500.00 (psychological level)
- Support 1: From $ 6200.00 (psychological level)
- Support 2: From $ 6100.00 (psychological level)
Computer analysis: The Stochastic Oscillator movings on the H1 chart are in the neutral zone, the continuation of the consolidation of the WTI price.