
Technical Analysis of Oil (Alexander Sivtsov)
Oil is trading above the zero mark in the Asian session.
The Brent graph (current price: $ 6360.70 per 100 barrels)
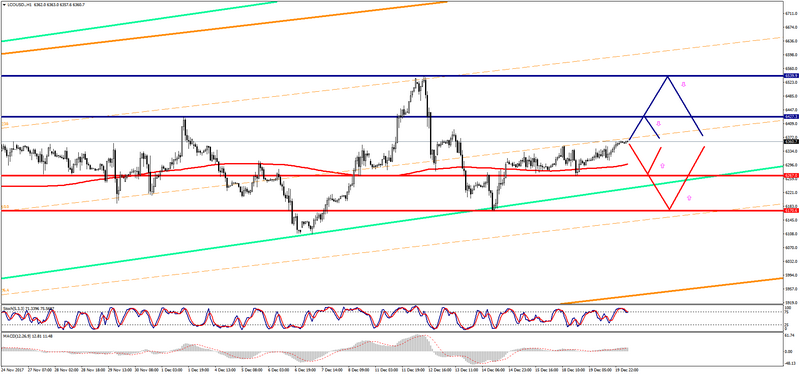
The Brent brand is trading above the zero mark during the Asian session.
- Resistance 1: From $ 6427.30 (December 1 maximum)
- Resistance 2: From $ 6539.90 (December 12 maximum)
- Support 1: From $ 6267.00 (December 18 minimum)
- Support 2: From $ 6170.60 (December 14 minimum)
Computer analysis: The Stochastic Oscillator movings on the charts of H1 and H4 indicate overbought of the instrument, against which one should expect a certain reduction in the Brent price.
The WTI graph (current price: $ 5771.10 per 100 barrels)
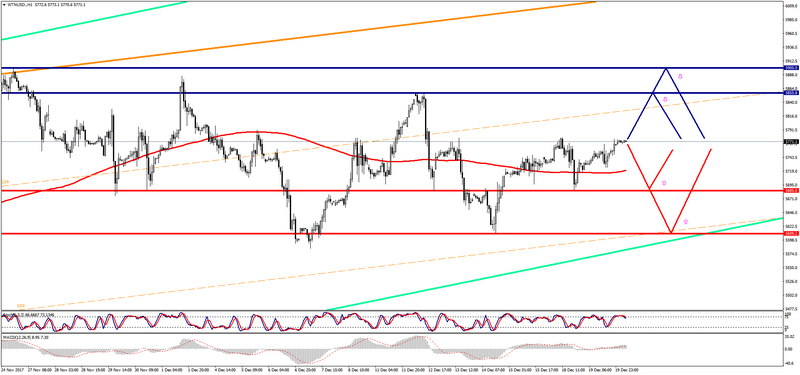
The WTI brand is trading with a plus during the Asian session.
- Resistance 1: From $ 5855.80 (December 12 maximum)
- Resistance 2: From $ 5900.00 (psychological level)
- Support 1: From $ 5685.00 (December 12 minimum)
- Support 2: From $ 5609.20 (December 14 minimum)
Computer analysis: The Stochastic Oscillator movings on the charts of H1 and H4 indicate overbought of the instrument, which may cause a slight decrease in the price of WTI in anticipation of data on oil reserves in the US.