
Technical Analysis of Oil (Alexander Sivtsov)
Oil is trading above the zero mark in the Asian session.
The Brent graph (current price: $ 6317.60 per 100 barrels)
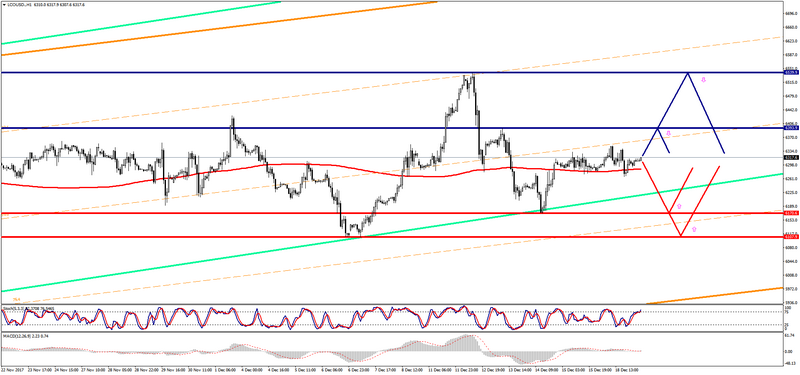
The Brent brand is trading above the zero mark during the Asian session.
- Resistance 1: From $ 6393.90 (December 13 maximum)
- Resistance 2: From $ 6539.90 (December 12 maximum)
- Support 1: From $ 6170.60 (December 14 minimum)
- Support 2: From $ 6107.90 (December 7 minimum)
Computer analysis: The Stochastic Oscillator movings on the charts of H4 and D1 are in the neutral zone, one should expect consolidation of the Brent price.
The WTI graph (current price: $ 5740.00 per 100 barrels)
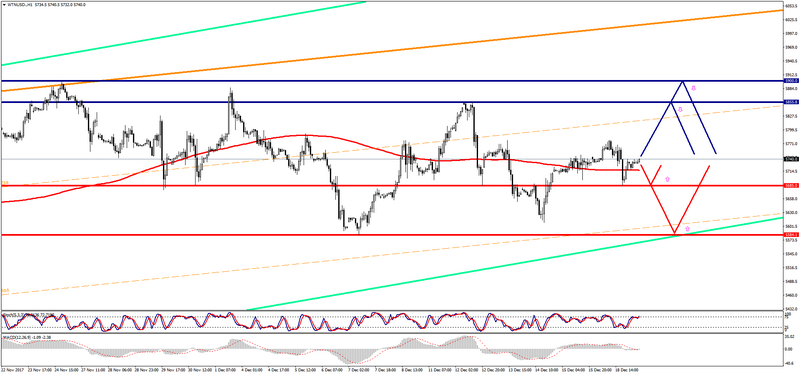
The WTI brand is trading with a plus during the Asian session.
- Resistance 1: From $ 5855.80 (December 12 maximum)
- Resistance 2: From $ 5900.00 (psychological level)
- Support 1: From $ 5685.00 (December 12 minimum)
- Support 2: From $ 5584.10 (December 7 minimum)
Computer analysis: The Stochastic Oscillator movings on the charts of H4 and D1 are in the neutral zone, the consolidation of the WTI price is possible in anticipation of data on oil reserves in the USA.