Technical Analysis of Oil (Alexander Sivtsov)
Oil is trading above the zero mark in the Asian session.
The Brent graph (current price: $ 6313.90 per 100 barrels)
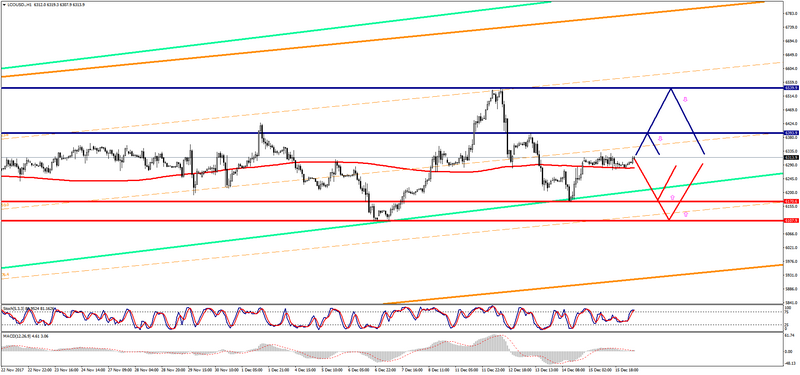
The Brent brand is trading above the zero mark during the Asian session.
- Resistance 1: From $ 6393.90 (December 13 maximum)
- Resistance 2: From $ 6539.90 (December 12 maximum)
- Support 1: From $ 6170.60 (December 14 minimum)
- Support 2: From $ 6107.90 (December 7 minimum)
Computer analysis: The Stochastic Oscillator movings on the H1 chart indicate overbought of the instrument, that is why there may be some decrease in Brent price.
The WTI graph (current price: $ 5762.40 per 100 barrels)
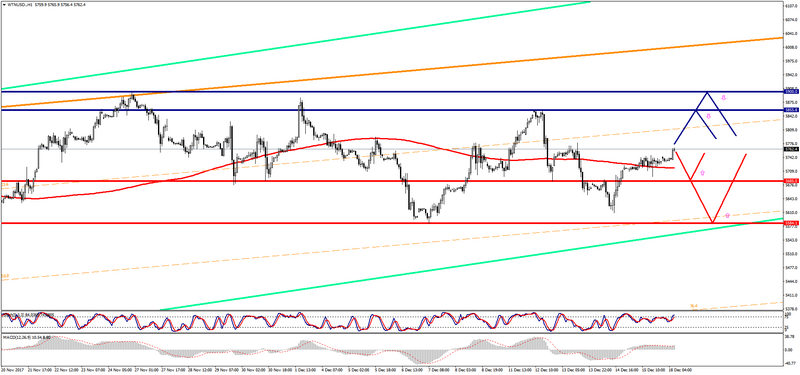
The WTI brand is trading with a plus during the Asian session.
- Resistance 1: From $ 5855.80 (December 12 maximum)
- Resistance 2: From $ 5900.00 (psychological level)
- Support 1: From $ 5685.00 (December 12 minimum)
- Support 2: From $ 5584.10 (December 7 minimum)
Computer analysis: The Stochastic Oscillator movings on the H1 chart indicate overbought of the instrument, which is why a slight decrease in the price of WTI is possible.